The Inverted Hammer candlestick pattern is an essential tool in the arsenal of traders and investors looking to identify potential bullish reversals in the market.
This comprehensive guide will provide an in-depth understanding of the Inverted Hammer pattern, its components, interpretation, and trading strategies. By mastering this pattern, you can improve your trading decisions and increase your chances of success in the market.
What is the Inverted Hammer Candlestick Pattern?
The Inverted Hammer is a candlestick pattern that occurs primarily at the bottom of downtrends, signaling a possible bullish reversal. This pattern is characterized by a small real body (the difference between the open and close prices) and a long upper shadow (the difference between the high and low prices).
The real body can be either green (bullish) or red (bearish), but a green real body is considered a stronger bullish signal.
Traders and investors pay close attention to the Inverted Hammer pattern because it can provide valuable insights into the market's sentiment and potential future price movements. However, it's essential to remember that this pattern should not be used in isolation. Instead, it should be combined with other technical analysis tools and indicators to generate reliable trading signals.
Components of the Inverted Hammer Candlestick Pattern
There are several key components that define the Inverted Hammer pattern:
Occurrence in a downtrend: The Inverted Hammer pattern typically appears at the bottom of a downtrend, indicating a potential bullish reversal. This is a crucial requirement for the pattern to be considered valid.
Small real body: The real body of the Inverted Hammer should be small, representing a narrow range between the open and close prices. This indicates that the market is undecided and that the bulls and bears are fighting for control.
Long upper shadow: The upper shadow of the Inverted Hammer should be at least twice the length of the real body. This represents a significant intraday price movement, with the bulls pushing the price higher but ultimately failing to maintain these gains. The long upper shadow is a sign of buying pressure, which may lead to a bullish reversal.
No or small lower shadow: The Inverted Hammer pattern should have little to no lower shadow, indicating that the low price is close to the open price. This demonstrates that the bears were unable to push the price significantly lower during the trading session.
How to Identify the Inverted Hammer Candlestick Pattern
To spot the Inverted Hammer pattern on a candlestick chart, you should look for the following criteria:
The pattern appears at the bottom of a downtrend, following a series of bearish candles.
The real body of the candle is small, indicating indecision in the market.
The upper shadow is at least twice the length of the real body, showing buying pressure.
There is little to no lower shadow, demonstrating that the bears were unable to push the price lower.
Green vs. Red Inverted Hammer Candlestick
The color of the Inverted Hammer's real body plays a crucial role in determining its bullishness. A green Inverted Hammer, where the open price is equal to the low price, is considered a stronger bullish signal than a red Inverted Hammer, where the close price is equal to the low price.
A green Inverted Hammer indicates that the bulls were able to push the price higher during the trading session and maintain some of those gains by the close. This shows a higher level of buying pressure and a more significant potential for a bullish reversal.
On the other hand, a red Inverted Hammer may still signal a potential bullish reversal, but the buying pressure is not as strong. In this case, the bulls were able to push the price higher during the session, but the bears regained control and pushed the price back down to the low by the close.
Interpreting the Inverted Hammer Candlestick Pattern
Here are some steps to help you interpret the Inverted Hammer pattern effectively:
Confirm the pattern's occurrence in a downtrend: The Inverted Hammer pattern should appear at the bottom of a downtrend, signaling a potential bullish reversal. If the pattern does not occur in a downtrend, it may not be a valid signal.
Evaluate the candle's color: A green Inverted Hammer is considered a stronger bullish signal than a red Inverted Hammer. Pay close attention to the color of the real body when interpreting the pattern.
Look for confirmation: The Inverted Hammer pattern is a warning of a potential price change, not a standalone buy signal. It's essential to wait for confirmation before entering a trade. Confirmation can come in the form of a bullish candle following the Inverted Hammer or other technical analysis tools, such as a trendline break or a moving average crossover.
Consider the trading volume: The trading volume during the formation of the Inverted Hammer pattern can provide additional insights into the strength of the buying pressure. A higher volume may indicate a stronger bullish reversal, while a lower volume may suggest a weaker signal.
Trading Strategies Based on the Inverted Hammer Candlestick Pattern
The Inverted Hammer pattern can be used as part of various trading strategies, depending on your trading style, risk tolerance, and market conditions. Here are some trading strategies that incorporate the Inverted Hammer pattern:
Trend reversal strategy: The Inverted Hammer pattern can be used as a signal to enter a long position after a downtrend. Once the pattern is confirmed by a bullish candle or another technical indicator, you can enter a long position with a stop-loss order below the low of the Inverted Hammer. The profit target can be set based on your risk-reward ratio or by using other technical analysis tools, such as resistance levels or Fibonacci retracements.
Swing trading strategy: The Inverted Hammer pattern can be used as a signal to enter a swing trade. Once the pattern is confirmed, you can enter a long position with a stop-loss order below the low of the Inverted Hammer. The profit target can be set based on a predetermined risk-reward ratio or by using other technical analysis tools, such as moving averages or support and resistance levels.
Breakout trading strategy: The Inverted Hammer pattern can be used as a signal to enter a breakout trade. Once the pattern is confirmed and the price breaks above a significant resistance level or trendline, you can enter a long position with a stop-loss order below the low of the Inverted Hammer. The profit target can be set based on your risk-reward ratio or by using other technical analysis tools, such as chart patterns or price projections.
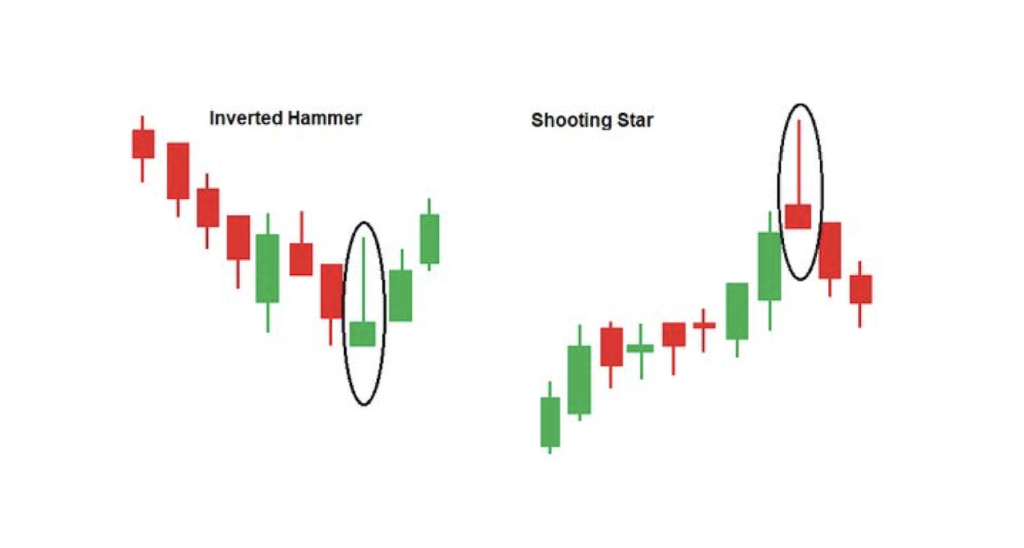
Inverted Hammer vs. Shooting Star Candlestick Pattern
The Inverted Hammer pattern is often compared to the Shooting Star pattern, as they share similar characteristics. However, their placement in time and the market context in which they occur are quite different.
The main difference between the two patterns is that the Shooting Star occurs at the top of an uptrend, signaling a potential bearish reversal, while the Inverted Hammer occurs at the bottom of a downtrend, indicating a potential bullish reversal.
It's essential to understand the differences between these two patterns to avoid confusion and ensure that you are correctly interpreting the market's signals.
Conclusion
The Inverted Hammer candlestick pattern is a valuable tool for traders and investors looking to identify potential bullish reversals in the market. By understanding its components, interpretation, and trading strategies, you can improve your trading decisions and increase your chances of success in the market.
Remember to combine the Inverted Hammer pattern with other technical analysis tools and indicators to generate reliable trading signals and manage your risk effectively.
NOTE: This article is not investment advice for anyone because online trading could be a high risk for all who have a lack of knowledge & experience. 86% of traders lose money in financial markets. we are not your financial advisors who guarantee your profit at all.