The world of trading can be both fascinating and intimidating, with various patterns and indicators that traders use to make informed decisions. One such pattern that has gained prominence among traders is the hammer candlestick pattern.
In this comprehensive guide, we will dive deep into the hammer candlestick pattern, its key characteristics, and how traders can use it effectively to maximize their trading potential.
What is a Hammer Candlestick Pattern?
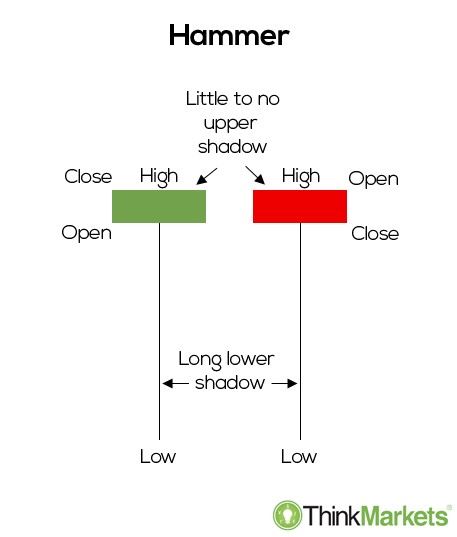
A hammer candlestick pattern is a technical trading pattern that resembles a "T" shape and occurs after a downtrend in the market. The pattern indicates a potential reversal to the upside, signaling that the security may have reached its bottom and is poised for a trend reversal.
Key Features of a Hammer Candlestick Pattern
Here are the main characteristics of a hammer candlestick pattern:
Occurs after a price decline or downtrend in the market.
Has a small real body, which represents the difference between the opening and closing prices.
Features a long lower shadow, at least twice the length of the real body.
The closing price can be above or below the opening price, but it should be near the opening price to maintain a small real body.
Indicates a potential price reversal to the upside, provided the pattern is confirmed by subsequent price action.
How to Identify a Hammer Candlestick Pattern
To identify a hammer candlestick pattern, traders should look for the following criteria:
A downtrend or declining price action is marked by a series of lower highs and lower lows.
A candlestick with a lower shadow that is at least twice the size of the real body.
A small real body, with the closing price near the opening price.
The pattern should resemble a "T" shape, indicating the potential for a hammer candlestick pattern.
The Importance of Confirmation in Hammer Candlestick Patterns
While the appearance of a hammer candlestick pattern can signal a potential price reversal to the upside, it is crucial for traders to seek confirmation before acting on this signal.
Confirmation occurs when the candle following the hammer closes above the closing price of the hammer. Ideally, this confirmation candle should show strong buying, indicating a higher likelihood of a sustained price reversal.
Traders typically look to enter long positions or exit short positions during or after the confirmation candle. A stop loss can be placed below the low of the hammer's shadow to protect the trader's position if the price reversal fails to materialize.
The Hammer Candlestick Pattern vs. the Doji
While both the hammer candlestick pattern and the doji pattern feature small real bodies, there are key differences between the two. A doji pattern signifies indecision in the market, as it has both an upper and a lower shadow. Depending on the confirmation that follows, a doji may signal a price reversal or a trend continuation.
On the other hand, a hammer candlestick pattern occurs after a price decline and signals a potential upside reversal, provided it is followed by confirmation. Unlike the doji, a hammer candlestick pattern only has a long lower shadow, indicating that buyers have managed to push the price back up near the opening price after sellers initially drove it down.
Limitations of Hammer Candlestick Patterns
It is important to note that hammer candlestick patterns are not foolproof indicators of price reversals. Even with confirmation, there is no guarantee that the price will continue to move to the upside.
Additionally, hammer candlestick patterns do not provide a price target, making it difficult for traders to determine the potential reward for a trade based on this pattern. Exits need to be based on other types of candlestick patterns or analysis.
The Psychology Behind Hammer Candlestick Patterns
A hammer candlestick pattern typically emerges during a downtrend when the market attempts to determine a bottom. The appearance of the hammer suggests that more bullish investors are taking positions in the security, signaling a potential reversal in the downward price movement.
The long lower shadow on the hammer candlestick indicates an effort by sellers to continue pushing the price down. However, the higher close represented by the real body indicates that the sellers were ultimately unsuccessful in holding the price at its intraday low. The price's ascent from its session low to a higher close suggests that a more bullish outlook prevailed, setting the stage for a potential reversal to the upside.
Practical Application of Hammer Candlestick Patterns
When traders spot a hammer candlestick pattern on a price chart, they may be eager to capitalize on the potential upcoming price movement. Here are some practical considerations for trading based on hammer candlestick patterns:
Ensuring a Valid Hammer Signal
First, traders should confirm that the pattern they observe on the candlestick chart corresponds to a hammer pattern. This means that it should occur during a downtrend, with a lower shadow at least twice the size of the real body and a closing price near the opening price.
Seeking Confirmation
As mentioned earlier, it is crucial for traders to wait for confirmation after identifying a hammer candlestick pattern. This confirmation occurs when the subsequent candle closes above the hammer's closing price, ideally with strong buying.
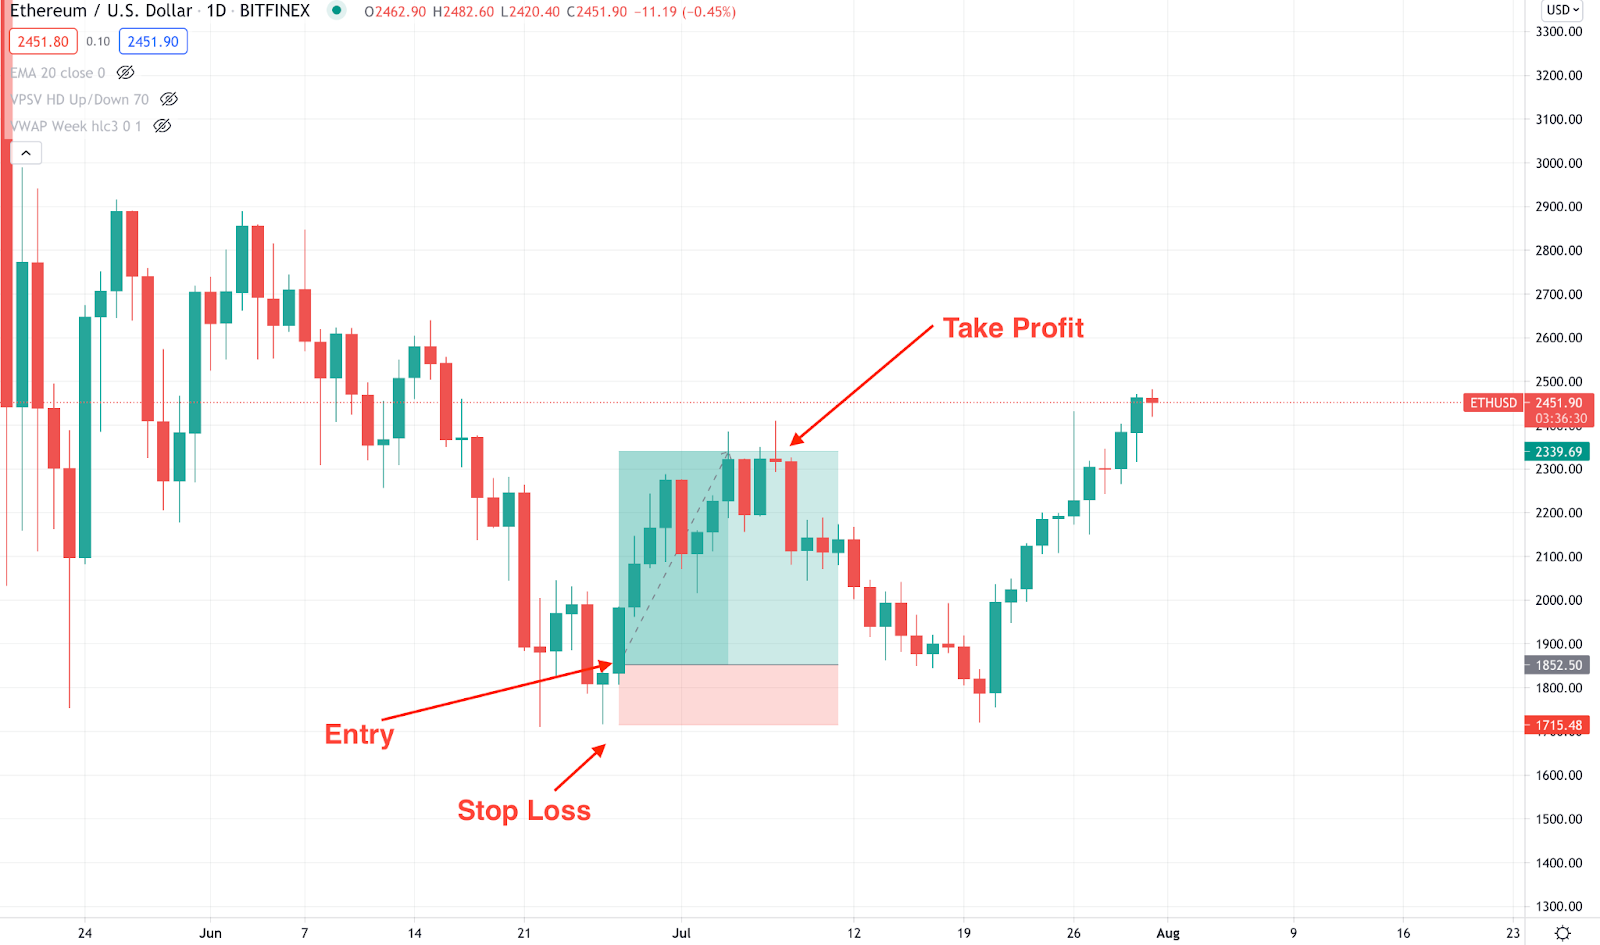
Placing Stop Losses and Taking Profits
Using stop losses is an essential part of trading, and it is advisable to set a stop loss below the low of the hammer pattern when trading based on this signal. This protects the trader's position in case the downward pressure reemerges and the anticipated upward move fails to materialize.
On the other hand, if the price does begin to rise, rewarding the trader's recognition of the hammer signal, it is necessary to decide on an optimal level to exit the trade and take profits.
Since the hammer signal does not provide guidance on where to set a take-profit order, traders may want to look for other resistance levels, such as nearby swing lows, to determine an ideal exit point.
Hammer Candlestick Patterns on Different Time Frames
It is essential to note that hammer candlestick patterns can occur in various time frames, including one-minute charts, daily charts, and weekly charts.
The reliability of the pattern may vary depending on the time frame, with longer time frames generally considered more reliable. However, traders should always consider other factors and use additional analysis techniques to confirm the validity of hammer candlestick patterns, regardless of the time frame.
Incorporating Hammer Candlestick Patterns into a Trading Strategy
While hammer candlestick patterns can be a valuable tool for traders seeking to identify potential price reversals, it is important to remember that they should not be used in isolation. Traders should combine the use of hammer candlestick patterns with other technical analysis techniques, such as trend analysis, price action analysis, and the use of technical indicators, to develop a comprehensive trading strategy.
Conclusion
The hammer candlestick pattern is a powerful technical trading tool that can help traders identify potential price reversals to the upside. By understanding the key features of this pattern, seeking confirmation, and incorporating it into a well-rounded trading strategy, traders can make more informed decisions and potentially improve their overall trading performance.
GENERAL RISK WARNING!
NOTE: This article is not investment advice for anyone because online trading could be a high risk for all who have a lack of knowledge & experience. 86% of traders lose money in financial markets. we are not your financial advisors who guarantee your profit at all.