The pin bar candlestick is a powerful and versatile trading tool that can provide traders with valuable insights into market sentiment and potential price reversals. In this comprehensive guide, we will dive deep into the world of pin bar candlesticks, discussing their formation, characteristics, and various trading strategies that can be employed to maximize profits.
What is a Pin Bar Candlestick?
A pin bar candlestick is a single candlestick pattern characterized by a small body and a long upper or lower shadow. The distinctive feature of a pin bar is its elongated shadow or wick, which signifies a strong rejection of a particular price level by the market participants. The pin bar candlestick is considered a potential reversal signal and can provide traders with valuable information about potential trend reversals in the market.
Anatomy of a Pin Bar Candlestick
To fully understand the pin bar candlestick, let's break down its anatomy:
Small Body: The body of a pin bar candlestick is relatively small compared to the length of its shadow. This small body represents the narrow price range between the open and close during the time period of the candle.
Long Shadow: The most distinguishing feature of a pin bar is its long shadow, either above or below the body. The shadow represents the price extreme reached during the time period of the candle before the market rejected it and moved back towards the open or close price.
Color: The color of the pin bar body can be either bullish (green) or bearish (red), depending on whether the closing price is higher or lower than the opening price.
Types of Pin Bar Candlesticks
There are two main types of pin bar candlesticks:
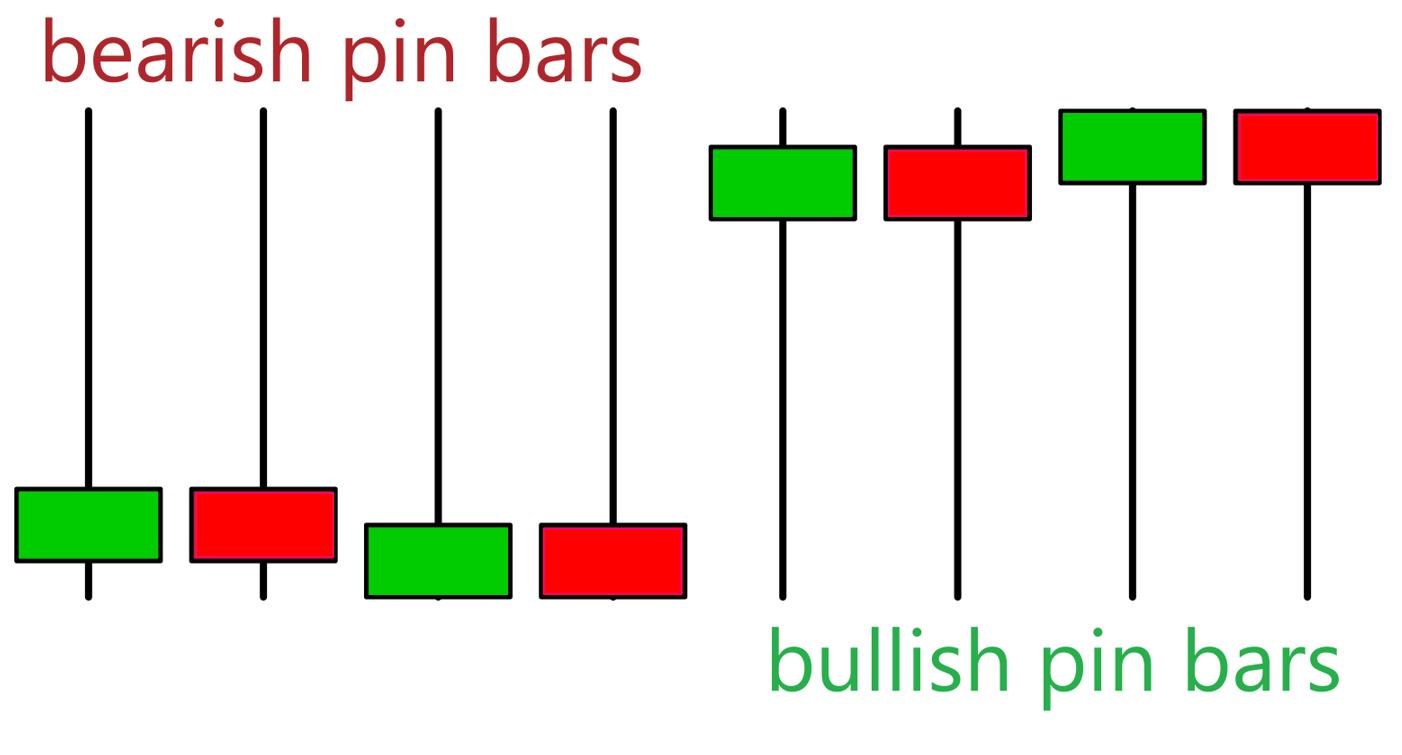
Bullish Pin Bar: A bullish pin bar is characterized by a long lower shadow and a small body at the top. This formation indicates that the bears pushed the price down during the session, but the bulls ultimately regained control and pushed the price back up, closing near the high of the session.
Bearish Pin Bar: A bearish pin bar has a long upper shadow and a small body at the bottom. This pattern shows that the bulls initially drove the price higher, but the bears took over and pushed the price back down, closing near the low of the session.
How to Identify a Pin Bar Candlestick
To spot a pin bar candlestick on a price chart, look for the following characteristics:
A small body relative to the length of the shadow.
A long shadow, either above or below the body, represents a significant price rejection.
The shadow should be at least twice the length of the body.
The pin bar should stand out from the surrounding price action, indicating a strong rejection of a specific price level.
You can also use technical analysis software, such as TradingView, to automatically identify pin bar candlesticks on your charts. However, it is essential to understand the pin bar's anatomy and characteristics to validate the software's findings manually.
Pin Bar Candlestick Formation
The formation of a pin bar candlestick can be attributed to the battle between bulls and bears in the market. When the market reaches a critical price level, one group of traders may attempt to push the price in their desired direction aggressively. However, if the opposing group of traders is strong enough, they can reject this price level and push the price back in the opposite direction. This rejection results in the formation of a pin bar candlestick, with its long shadow indicating the failed attempt to break through the critical price level.
Key Price Levels and Support/Resistance
Pin bars often form at key price levels, such as support and resistance zones, trendlines, and moving averages. These levels are areas where market participants are more likely to make significant buying or selling decisions, resulting in a higher probability of price reversals.
Psychological Factors
Market psychology also plays a crucial role in the formation of pin bar candlesticks. When a price level is rejected, it can lead to a shift in market sentiment, causing traders who initially pushed the price to question their positions and potentially reverse their trades. This shift in sentiment can lead to a strong price reversal and the formation of a pin bar candlestick.
Pin Bar Trading Strategies
Now that we understand the formation and characteristics of the pin bar candlestick let's explore some trading strategies that can be employed to capitalize on the signals provided by these powerful patterns.
Pin Bar Reversal Strategy
The primary function of the pin bar candlestick is to signal potential reversals in the market. To employ a pin bar reversal strategy, traders should look for pin bar formations at key price levels, such as support and resistance zones or trendlines.
Identify a pin bar candlestick at a key price level.
Wait for the pin bar to close and confirm the rejection of the price level.
Enter a trade in the opposite direction of the pin bar's shadow.
Place a stop-loss order slightly beyond the tip of the pin bar's shadow to protect against false signals.
Set a profit target based on a risk-reward ratio or a predetermined price level.
Pin Bar Breakout Strategy
The pin bar breakout strategy aims to capitalize on the momentum generated by a pin bar's price rejection. This strategy is particularly useful when trading with the trend, as it allows traders to enter the market at more favorable price levels.
Identify a pin bar candlestick in the direction of the prevailing trend.
Place a stop order beyond the tip of the pin bar's shadow, in the direction of the trend.
Place a stop-loss order slightly beyond the opposite end of the pin bar's shadow.
Set a profit target based on a risk-reward ratio or a predetermined price level.
Pin Bar Multi-Timeframe Analysis
Using multi-timeframe analysis, traders can increase the accuracy and reliability of the pin bar trading strategy. By analyzing pin bar formations on multiple timeframes, traders can confirm the validity of the reversal signal and potentially identify additional confluence factors that support the trade.
Identify a pin bar candlestick on your primary trading timeframe.
Analyze higher and lower timeframes to confirm the pin bar's validity and look for additional supporting factors, such as key price levels or chart patterns.
Execute the trade using either the pin bar reversal or breakout strategy, as appropriate.
Combining Pin Bar Candlesticks with Other Technical Analysis Tools
To further enhance the effectiveness of the pin bar trading strategy, traders can combine pin bar candlesticks with other technical analysis tools and indicators.
Moving Averages
Traders can use moving averages to confirm the validity of a pin bar reversal signal. For example, if a bearish pin bar forms below a significant moving average, it may indicate a higher probability of a bearish reversal.
Relative Strength Index (RSI)
The Relative Strength Index (RSI) can be used in conjunction with pin bar candlesticks to identify overbought or oversold conditions in the market. If a pin bar forms when the RSI is in overbought or oversold territory, it may signal a higher probability of a price reversal.
Chart Patterns
Traders can also look for price action patterns, such as double tops or bottoms, head and shoulders, and wedges, in conjunction with pin bar candlesticks to identify potential trend reversals or continuations.
Final Thoughts
The pin bar candlestick is a powerful and versatile trading tool that can provide traders with valuable insights into market sentiment and potential price reversals. By understanding the formation, characteristics, and various trading strategies associated with pin bar candlesticks, traders can potentially maximize their profits and improve their trading performance. Remember to always practice proper risk management and use stop-loss orders to protect against potential losses.
NOTE: This article is not investment advice for anyone because online trading could be a high risk for all who have a lack of knowledge & experience. 86% of traders lose money in financial markets. we are not your financial advisors who guarantee your profit at all.