Candlestick charts are an essential tool for traders to analyze the market's price movement. It is a popular method in technical analysis that has been used for centuries in Japan. A candlestick chart consists of a series of bars that represent price movements over a particular period. These charts are used to identify patterns and trends in the market, which can help traders make informed decisions about when to buy and sell.
What is a Shooting Star Candlestick?
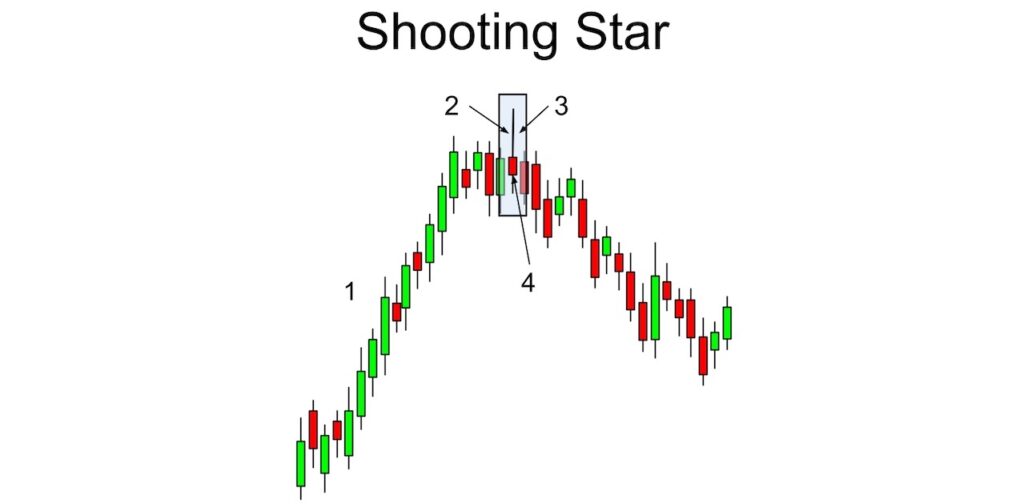
A shooting star is a type of candlestick pattern that signals a possible reversal in the market's trend. It is a bearish candlestick pattern that forms when the price opens higher than the previous day's close, trades higher during the day, but then closes near the day's low. The shooting star candlestick looks like a small candlestick with a long upper shadow and a small lower body. It gets its name because it looks like a shooting star with a long tail.
Anatomy of a Shooting Star Candlestick
A shooting star candlestick consists of a small body and a long upper shadow. The body of the candlestick is formed by the difference between the opening and closing prices. The upper shadow is formed by the difference between the highest price and the closing price. The lower shadow is usually very small or nonexistent.
The length of the upper shadow is an essential factor in identifying a shooting star candlestick. The longer the upper shadow, the more significant the shooting star pattern. The upper shadow should be at least twice the length of the body of the candlestick.
Interpretation of a Shooting Star Candlestick
The shooting star candlestick pattern is a bearish reversal pattern that occurs after an uptrend. It signals that the bulls are losing control of the market, and the bears may take over. The long upper shadow represents the bulls' attempt to push the price higher, but the bears eventually take over and push the price lower, resulting in a close near the day's low.
The shooting star pattern is usually more reliable when it occurs after a long uptrend, and the higher the price goes, the more significant the shooting star pattern will be. It is a signal to traders to start looking for short positions.
How to Identify Shooting Star Candlestick Patterns
Identifying a shooting star candlestick pattern is relatively easy. Traders need to look for a candlestick with a small body and a long upper shadow. The upper shadow should be at least twice the length of the body of the candlestick. The lower shadow should be very small or nonexistent.
It is essential to look for the shooting star pattern after a long uptrend. The higher the price goes, the more significant the shooting star pattern will be. Traders should also look for confirmation of the pattern by looking for a bearish candlestick pattern the following day.
Limitations of Shooting Star Candlestick Patterns
While shooting star patterns can be useful in identifying potential reversals in the market, they are not always reliable. In some cases, the pattern may not result in a reversal, and traders who act on the pattern may end up losing money.
It is essential to use other technical indicators to confirm the shooting star pattern. Traders should also consider other factors, such as market conditions, news events, and economic data before making any trading decisions.
Examples of Shooting Star Candlestick Patterns in Trading
Let's take a look at some examples of shooting star candlestick patterns in trading. In the chart below, we can see a shooting star pattern that occurred after a long uptrend. The price opened higher than the previous day's close, traded higher during the day, but then closed near the day's low, forming a small body and a long upper shadow.
In this example, we can see that the shooting star pattern was followed by a bearish candlestick pattern the following day, confirming the reversal. Traders who acted on the shooting star pattern could have taken a short position and made a profit.
Trading Strategies Using Shooting Star Candlestick Patterns
Shooting star patterns can be used in a variety of trading strategies. One common strategy is to use the shooting star pattern as a signal to enter a short position. Traders can place a stop loss above the shooting star pattern's high and take profit at the next support level.
Another strategy is to use the shooting star pattern in conjunction with other technical indicators, such as moving averages or trend lines. Traders can use these indicators to confirm the shooting star pattern and identify potential entry and exit points.
Common Mistakes to Avoid When Trading with Shooting Star Candlestick
Traders should be aware of some common mistakes when using shooting star candlestick patterns. One mistake is to rely solely on the shooting star pattern without considering other technical indicators or market conditions. Traders should use the shooting star pattern as a signal but should also consider other factors before making any trading decisions.
Another mistake is to ignore the shooting star pattern's limitations and assume that it will always result in a reversal. Traders should use the shooting star pattern in conjunction with other technical indicators and should consider other factors before making any trading decisions.
Conclusion
Shooting star candlestick patterns are an essential tool for traders to identify potential reversals in the market. Traders should look for a candlestick with a small body and a long upper shadow after a long uptrend. It is essential to use other technical indicators and consider other factors before making any trading decisions.
Traders should also be aware of the shooting star pattern's limitations and avoid common mistakes, such as relying solely on the pattern or ignoring other technical indicators and market conditions. By using shooting star candlestick patterns in conjunction with other technical indicators, traders can make informed decisions and increase their chances of success in the market.