Understanding chart patterns is crucial for traders to make accurate decisions in the financial market. Two common chart patterns that traders encounter are the double top and double bottom patterns. These patterns can help traders identify potential trend reversals, which could lead to profitable trading opportunities.
In this guide, we will explore the concept of double-top and double-bottom patterns and discuss their significance, limitations, and trading strategies.
What are Double Top and Double Bottom Patterns?
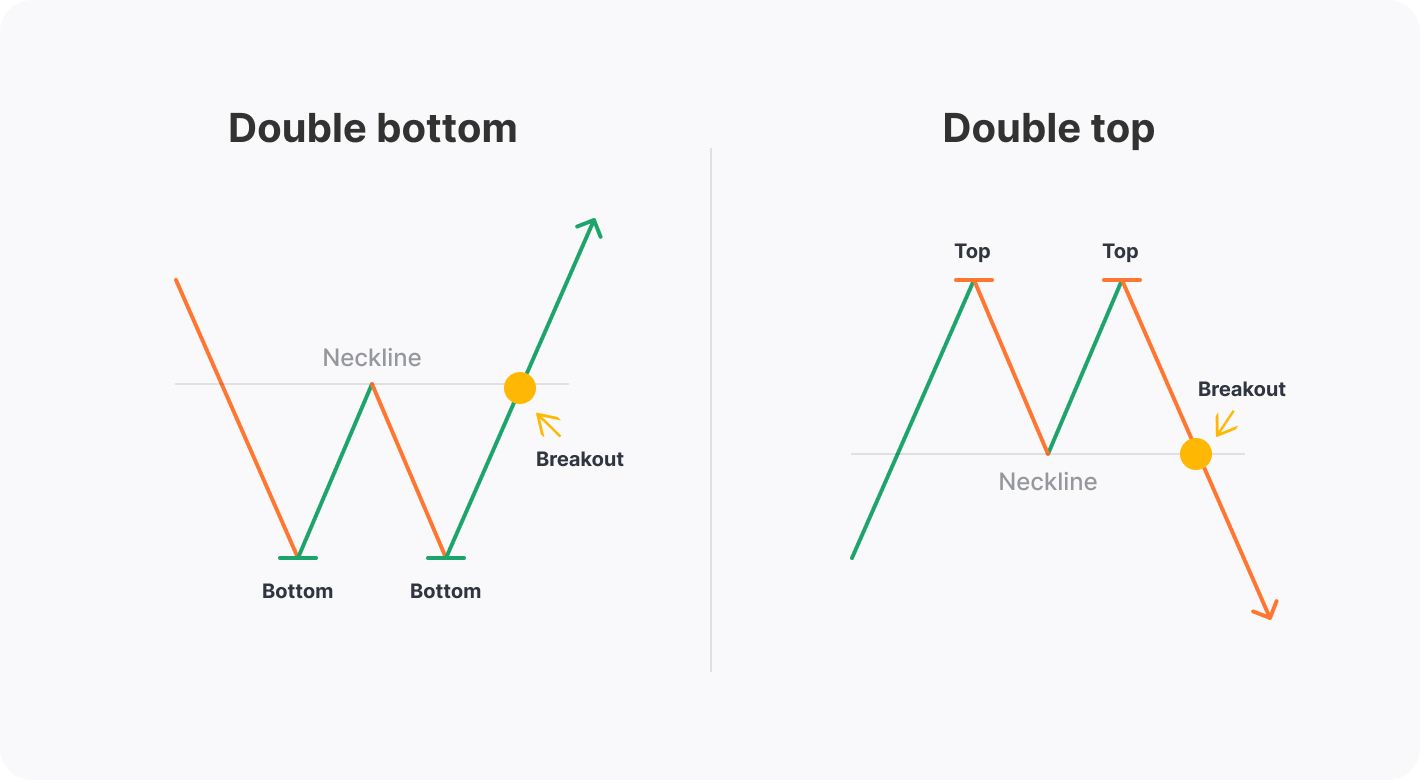
Double top and double bottom patterns are chart patterns that occur when the price action of a security or other investment moves in a pattern similar to the letter "M" (double top) or "W" (double bottom).
These patterns are used in technical analysis to explain movements in a security or other investment and can be used as part of a trading strategy to exploit recurring patterns.
Key Takeaways
Double tops and bottoms are important technical analysis patterns used by traders.
A double top has an 'M' shape and indicates a bearish reversal in trend.
A double bottom has a 'W' shape and is a signal for a bullish price movement.
Understanding Double Tops and Bottoms
Double top and bottom patterns typically evolve over a longer period of time, and do not always present an ideal visual of a pattern because the shifts in prices don't necessarily resemble a clear "M" or "W". When reviewing the chart pattern, it is important for investors to note that the peaks and troughs do not have to reach the same points in order for the "M" or "W" pattern to appear.
Double top and bottom patterns are formed from consecutive rounding tops and bottoms. These patterns are often used in conjunction with other indicators since rounding patterns in general can easily lead to fakeouts or mistaking reversal trends.
Double Top Pattern
A double top pattern is formed from two consecutive rounding tops. The first rounding top forms an upside-down U pattern. Rounding tops can often be an indicator of a bearish reversal as they often occur after an extended bullish rally. Double tops will have similar inferences.
If a double top occurs, the second rounded top will usually be slightly below the first rounded top's peak indicating resistance and exhaustion. Double tops can be rare occurrences with their formation often indicating that investors are seeking to obtain final profits from a bullish trend. Double tops often lead to a bearish reversal in which traders can profit from selling the stock on a downtrend.
Image by Sabrina Jiang (C) Investopedia
Double Bottom Pattern
Double-bottom patterns are essentially the opposite of double-top patterns. Results from this pattern have the opposite inferences. A double bottom is formed following a single rounding bottom pattern which can also be the first sign of a potential reversal. Rounding bottom patterns will typically occur at the end of an extended bearish trend.
The double bottom formation constructed from two consecutive rounding bottoms can also infer that investors are following the security to capitalize on its last push lower toward a support level. A double bottom will typically indicate a bullish reversal which provides an opportunity for investors to obtain profits from a bullish rally. After a double bottom, common trading strategies include long positions that will profit from a rising security price.
Double top and bottom formations are highly effective when identified correctly. However, they can be extremely detrimental when they are interpreted incorrectly. Therefore, one must be extremely careful and patient before jumping to conclusions.
For instance, there is a significant difference between a double top and one that has failed. A real double top is an extremely bearish technical pattern which can lead to an extremely sharp decline in a stock or asset. However, it is essential to be patient and identify the critical support level to confirm a double top's identity. Basing a double top solely on the formation of two consecutive peaks could lead to a false reading and cause an early exit from a position.
Trading Strategies for Double Tops and Bottoms
Trading strategies for double top and double bottom patterns can vary depending on the trader's experience, risk tolerance, and market conditions. However, some general guidelines can be followed to make the most of these patterns.
Double Top Trading Strategies
Confirmation: Wait for the double top pattern to be confirmed by a break below the support level, also known as the neckline, before entering a short position.
Stop Loss: Place a stop loss above the second peak to protect against false reversals and minimize losses.
Profit Target: The profit target for a double top pattern can be calculated by measuring the distance between the support level and the peaks, then subtracting that value from the support level.
Double Bottom Trading Strategies
Confirmation: Wait for the double bottom pattern to be confirmed by a break above the resistance level, also known as the neckline, before entering a long position.
Stop Loss: Place a stop loss below the second trough to protect against false reversals and minimize losses.
Profit Target: The profit target for a double bottom pattern can be calculated by measuring the distance between the resistance level and the troughs, then adding that value to the resistance level.
Additional Tools and Indicators for Trading Double Tops and Bottoms
To increase the accuracy of double top and double bottom patterns, traders can use additional tools and indicators. These can help to filter out false signals and improve the overall trading strategy. Some popular tools and indicators include:
Volume: Analyzing trading volume can help confirm the pattern. For double tops, the volume should decrease as the second peak forms, while for double bottoms, the volume should increase as the second trough forms.
Trendlines: Drawing trendlines can help visualize the pattern and identify key support and resistance levels.
Moving Averages: Using moving averages, such as the 50-day or 200-day moving average, can provide additional support or resistance levels to consider when trading double top and double bottom patterns.
Relative Strength Index (RSI): The RSI can help identify overbought or oversold conditions, which can provide additional confirmation for double top and double bottom patterns.
Final Thoughts
Double top and double bottom patterns can be powerful tools for traders looking to identify potential trend reversals and capitalize on profitable trading opportunities.
By understanding the key characteristics of these patterns, applying appropriate trading strategies, and using additional tools and indicators, traders can increase their chances of success in the market. However, it is crucial to remain patient, practice proper risk management, and always be prepared for the possibility of false signals.
GENERAL RISK WARNING!
NOTE: This article is not investment advice for anyone because online trading could be a high risk for all who have a lack of knowledge & experience. 86% of traders lose money in financial markets. we are not your financial advisors who guarantee your profit at all.


:max_bytes(150000):strip_icc()/dotdash_Final_Double_Top_and_Bottom_Feb_2020-01-568b13a6e22548a48c0f5251e2069db5.jpg)
:max_bytes(150000):strip_icc()/Clipboard01-5c67349746e0fb0001f0fb17.jpg)