With that being said let's get into today’s article, when it comes to trading a lot of traders focus on finding the perfect indicator so they chase the Moving Average, RSI, MACD, stochastic, etc. But the truth is that all of these indicators are lagging indicators.
Introduction
This means that they use price as an input therefore they signal an uptrend after the price has already moved. That’s not mean you should not use indicators.
In fact, indicators are a great way to confirm your bias the point I am trying to make is that we should focus more on the raw price chart and focus less on indicators Price Action analysis means using the raw candlestick chart to analyze the market without using any indicators.
4 Price Action Trading Secrets
Here are four price action trading secrets that will change the way your trade.
Secret #1: Price Has a Mean Reversion Tendency
The price of any asset has a tendency of mean reversion which means that the price cannot stay away from its average for a long time to understand this concept let's plot a 50 period EMA.
Price Action Trading Secrets
Here we can see that the market was clearly in a strong downtrend but whenever the price moved far away from the moving average a strong up move will follow soon.
Hence the price does not stay away from the moving average for longer durations the same thing is applicable in an uptrend as you can see whenever the price moves away from the moving average the price creates a reversal and gets attracted back to the Moving Average.
Moving Average Attracts the Price like A Magnet
So in other words we can say that the moving average attracts the price like a magnet. Therefore whenever we notice that the price is far above the 50 period EMA then we can look for selling opportunities.
Our target should be the moving average itself similarly when we see that the price is far below the 50 EMA we will look for buying opportunities and the target will be the Moving Average.
Secret #2: Shallow Pullbacks Lead To Large Moves
When the price is in a trend it does not move in a straight line instead it moves in a zigzag pattern the price moves that are against the trend are called pullbacks.
Price Action Trading Secrets
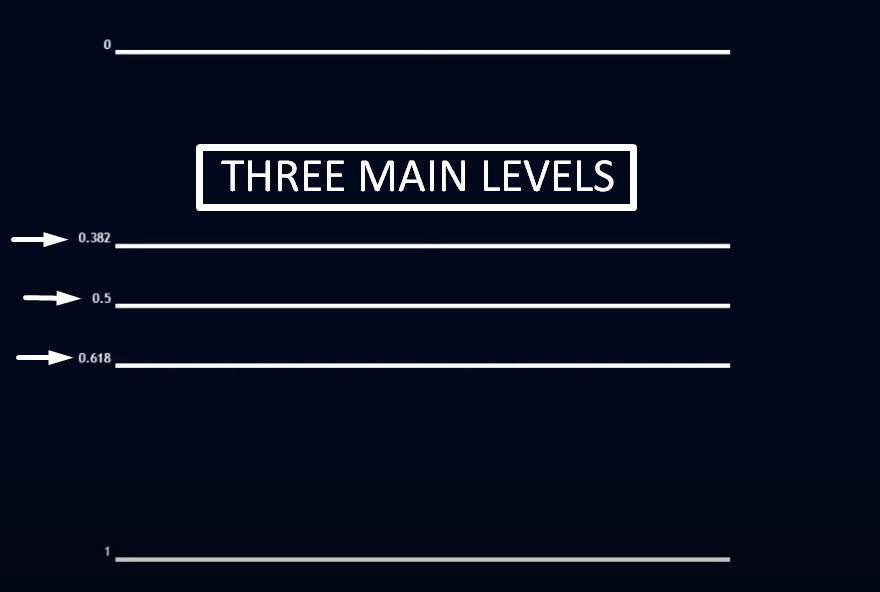
Pullbacks are a result of fatigue and profit-taking among traders. Hence pullbacks can provide us with a lot of information about the traders a common practice of technical analysts is to measure the pullback with a Fibonacci retracement tool by default the Fibonacci comes with a lot of price levels but I like a cleaner chart.
Hence I only use three levels 0.382, 0.5, and 0.618 now to measure the pullback the low of the move, and the high of the move.
When the price makes a pullback if it does not go beyond the 0.382 level it is called a shallow pullback.
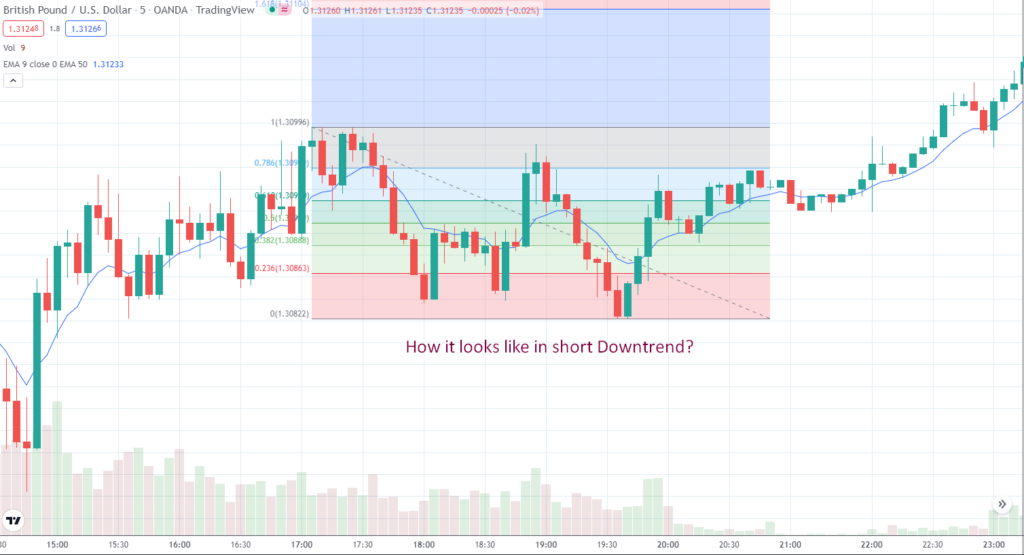
Shallow pullbacks lead to a larger move for instance look at this chart. Here we see the market make a strong down move so we plot the Fibonacci retracement tool to measure the pullback as you can see the pullback is short and shallow.
It does not go beyond the 0.382 level so we can expect a strong down move and as you can see there was a sharp sell-off after the shallow pullback.
As you see in the previous chart picture, we see a strong down move so we plot the retracement tool and wait for the pullback in this case the pullback pushes up until the 0.618 level. Hence it is a deeper pullback the market does move downwards in this case as well but the down move was a normal move it was not as large as the previous one. So shallow pullbacks always lead to a large move, just keep in your mind.
Secret #3: Big Body Candles Show Conviction
When it comes to candlesticks a lot of traders focus a lot on the upper and lower wicks of candles but the secret is that wicks are not as important as the body of the candle. Candles with big bodies convey a strong message.
Price Action Trading Secrets
For instance look at this candle, this candle is a Red bearish candle that has a large body, and no wicks at all this candle were formed because sellers found this price so attractive that they started selling in huge quantities.
The selling pressure was so high that the price kept going down the buyers were so weak that they could not fight back against the sellers. The candle had a strong close so we see this large candle and we can say that this price was very attractive for the seller. Hence if the price comes back around the area the sellers will once again come into action and sell again that is exactly what happens here. All of this happened because we noticed the big body on this candle and understood the meaning behind it.
Price Action Trading Secrets
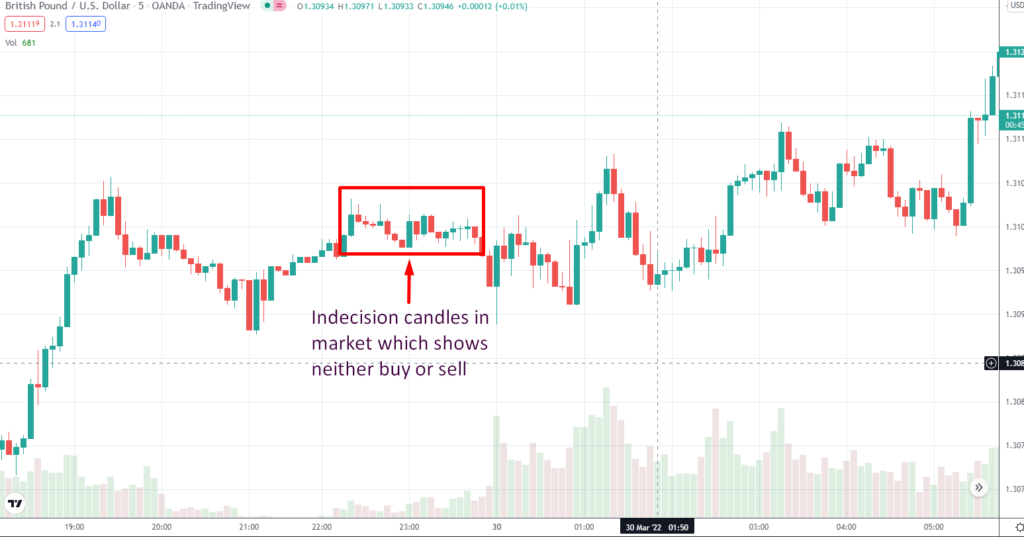
On the other hand, if we look at these sets of candles we can conclude that the body size of these candles is very small when compared to the previous candles these candles indicate indecision in the market neither buyer nor the seller is interested in trade. They are just reacting to the forces of each other and we see a period of consolidation.
Secret #4: Momentum Matters
Momentum means the rate at which something moves in our case we are talking about the rate at which the price moves on a price chart momentum can be measured by the angle of a particular move. We don't need to know the exact angle of the move but we want to compare two moves to find out if the latest move is steeper or more gradual.
For example, look at this chart here we can see that this up move is steeper than the previous up move this means that the buyers are still stronger and have gained strength.
Price Action Trading Secrets
In other words, the up move has gained momentum. Hence we can expect the trend to continue on the other hand if we look at this chart here we see that the recent up move was gradual and shallow than the previous up move. The momentum has been reduced so we can expect the market to reverse and that is what happens the market sees a strong downtrend very soon.
So if you like this blog please also share it with your friends and leave a comment below here.
NOTE: This article is not investment advice for anyone because online trading could be a high risk for all who have a lack of knowledge & experience. 95% of traders lose money in financial markets. we are not your financial advisors who guarantee your profit at all.