Candlestick psychology is a trading technique used to analyze market trends and make trading decisions. It is based on the use of candlestick charts, which are a visual representation of price movements in the market.
Candlestick charts provide traders with valuable information on market trends and price action, which can be used to predict future price movements. In this guide, we will explore the art of candlestick psychology and how it can be used to master the market.
Understanding Market Trends
Market trends refer to the direction in which the market is moving. They are determined by analyzing the price movements of a particular asset over a period of time. Market trends can be either bullish (upward) or bearish (downward), and they can be short-term or long-term. Understanding market trends is important for traders as it helps them to make informed trading decisions.
The History of Candlestick Charts
Candlestick charts were first developed in Japan in the 18th century by rice traders. They were used to track the price movements of rice and were called "rice paper charts."
Candlestick charts were later introduced to the Western world in the 20th century by Steve Nison, a trader, and author. Nison's book, "Japanese Candlestick Charting Techniques," introduced candlestick charts to the Western world and popularized the use of candlestick charts in trading.
The Basics of Candlestick Charting
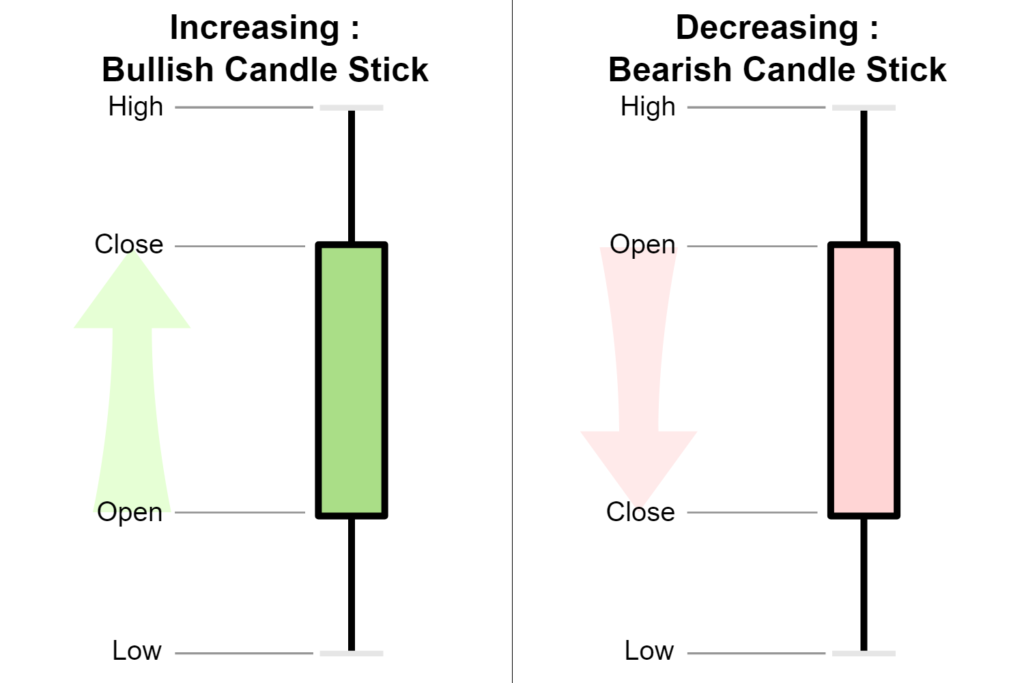
Candlestick charts are a visual representation of price movements in the market. They consist of a series of bars or "candles," each representing a specific period of time. The body of the candle represents the opening and closing price of the asset, while the wicks or "shadows" represent the highest and lowest price points during the period.
Candlestick charts can be used to analyze market trends, identify support and resistance levels, and predict future price movements. They are a valuable tool for traders as they provide a clear and concise picture of price action in the market.
The Psychology Behind Candlestick Patterns
Candlestick patterns are formed by the price movements of an asset over a period of time. They are used to predict future price movements and identify potential trading opportunities. Candlestick patterns can be either bullish or bearish, depending on the direction of the trend.
The psychology behind candlestick patterns is based on the emotions of traders in the market. Bullish patterns indicate that buyers are in control of the market, while bearish patterns indicate that sellers are in control. Understanding the psychology behind candlestick patterns is important for traders as it helps them to make informed trading decisions.
Understanding the Different Types of Candlestick Patterns
There are several different types of candlestick patterns, each with its own unique characteristics and significance. Some of the most common candlestick patterns include doji, hammer, shooting star, engulfing, and harami.
Doji patterns indicate indecision in the market and are often seen at the end of a trend.
Hammer patterns indicate a potential reversal in the market and are often seen at the bottom of a downtrend.
Shooting star patterns indicate a potential reversal in the market and are often seen at the top of an uptrend.
Engulfing patterns indicate a potential reversal in the market and occur when a larger candle "engulfs" the previous candle.
Harami patterns indicate a potential reversal in the market and occur when a smaller candle is contained within the body of a larger candle.
Using Candlestick Patterns to Identify Market Trends
Candlestick patterns can be used to identify market trends and make informed trading decisions. Bullish patterns indicate that buyers are in control of the market and that the trend is likely to continue upward. Bearish patterns indicate that sellers are in control of the market and that the trend is likely to continue downward.
candlestick patterns
Traders can use candlestick patterns in conjunction with other technical indicators to confirm market trends and make trading decisions. It is important to remember that candlestick patterns are not foolproof and should be used in conjunction with other forms of analysis.
Candlestick Psychology and Risk Management
Candlestick psychology can also be used to manage risk in trading. By understanding the psychology behind candlestick patterns, traders can identify potential trading opportunities and manage their risk accordingly.
Traders can use stop-loss orders to limit their losses and protect their capital. Stop-loss orders are orders that are placed at a certain price point and are designed to automatically close out a trade if the price reaches that point. Traders can also use position sizing to manage their risk. Position sizing involves determining the size of a trade based on the amount of capital available and the level of risk that the trader is willing to take on.
Common Mistakes to Avoid in Candlestick Psychology
There are several common mistakes that traders make when using candlestick psychology. One of the most common mistakes is relying too heavily on candlestick patterns without considering other forms of analysis. It is important to use candlestick patterns in conjunction with other forms of analysis to confirm market trends and make informed trading decisions.
Another common mistake is not managing risk properly. Traders should always use stop-loss orders and position sizing to manage their risk and protect their capital. They should also avoid overtrading and taking on too much risk.
Recommended Resources for Mastering Candlestick Psychology
There are several resources available for traders who want to master candlestick psychology. Some of the most popular resources include books, courses, and online forums. Some of the most popular books on candlestick charting include "Japanese Candlestick Charting Techniques" by Steve Nison and "Candlestick Charting Explained" by Gregory L. Morris.
There are also several online courses available that focus on candlestick charting and candlestick psychology. These courses cover topics such as candlestick patterns, market trends, and risk management. Online forums are also a valuable resource for traders as they provide a platform for traders to share ideas and strategies.
Conclusion
Candlestick psychology is a valuable tool for traders who want to analyze market trends and make informed trading decisions. By understanding the psychology behind candlestick patterns, traders can identify potential trading opportunities and manage their risk effectively.
It is important to remember that candlestick patterns should be used in conjunction with other forms of analysis to confirm market trends and make informed trading decisions. With the right knowledge and resources, traders can master the art of candlestick psychology and achieve success in the market.
GENERAL RISK WARNING!
NOTE: This article is not investment advice for anyone because online trading could be a high risk for all who have a lack of knowledge & experience. 86% of traders lose money in financial markets. we are not your financial advisors who guarantee your profit at all.