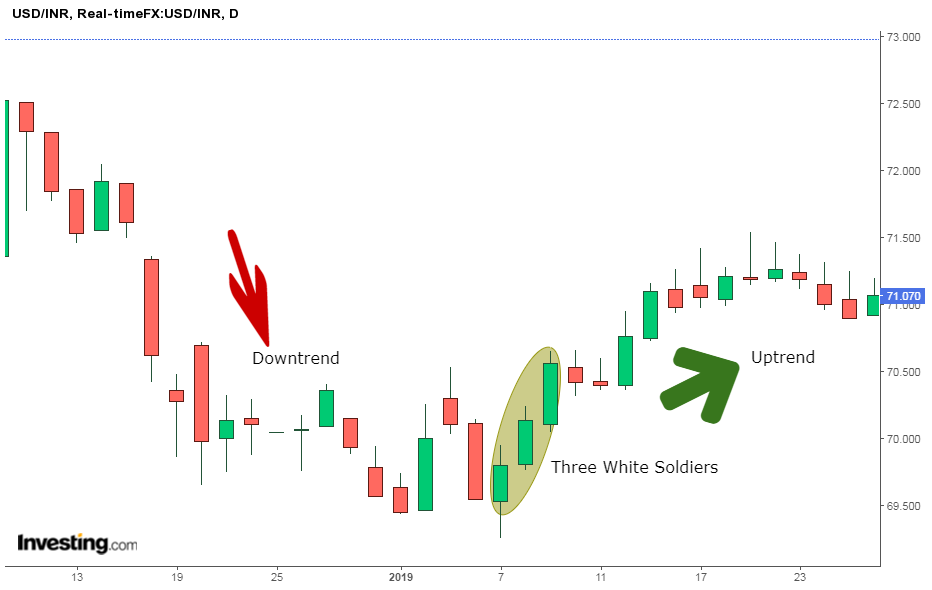
The Three White Soldiers pattern is a powerful bullish candlestick pattern that signals a potential reversal of the current downtrend in a market chart.
This pattern is formed by three consecutive long-bodied candlesticks with each candle opening within the real body of the previous one and closing at a higher point than the previous candle's high.
we will delve into the intricacies of the Three White Soldiers pattern, its significance in trading, and how to effectively trade using this pattern in conjunction with other technical indicators.
Key Features of the Three White Soldiers Pattern
1. Consecutive Long-Bodied Candlesticks
The Three White Soldiers pattern comprises three consecutive long-bodied candlesticks. These candles signify a strong buying momentum, with each candle opening within the real body of the previous candle and closing at a higher point than the previous candle’s high. This indicates that the bulls are in control of the market during these three sessions.
2. No Long Shadows
The ideal Three White Soldiers pattern should not have very long shadows. This means that the candlesticks' wicks should be relatively short compared to the candlesticks' real bodies. The absence of long shadows indicates that the bulls were able to maintain the price at the top of the range for the entire trading session.
3. Opening within the Real Body of the Preceding Candle
Each candle in the Three White Soldiers pattern should ideally open within the real body of the preceding candle. This indicates that the bulls are consistently overpowering the bears, leading to a potentially strong bullish reversal.
Key Takeaways of the Three White Soldiers Pattern
The Three White Soldiers pattern is considered a reliable reversal pattern when confirmed by other technical indicators, such as the Relative Strength Index (RSI).
The size of the candles and the length of the shadows are used to judge the risk of retracement.
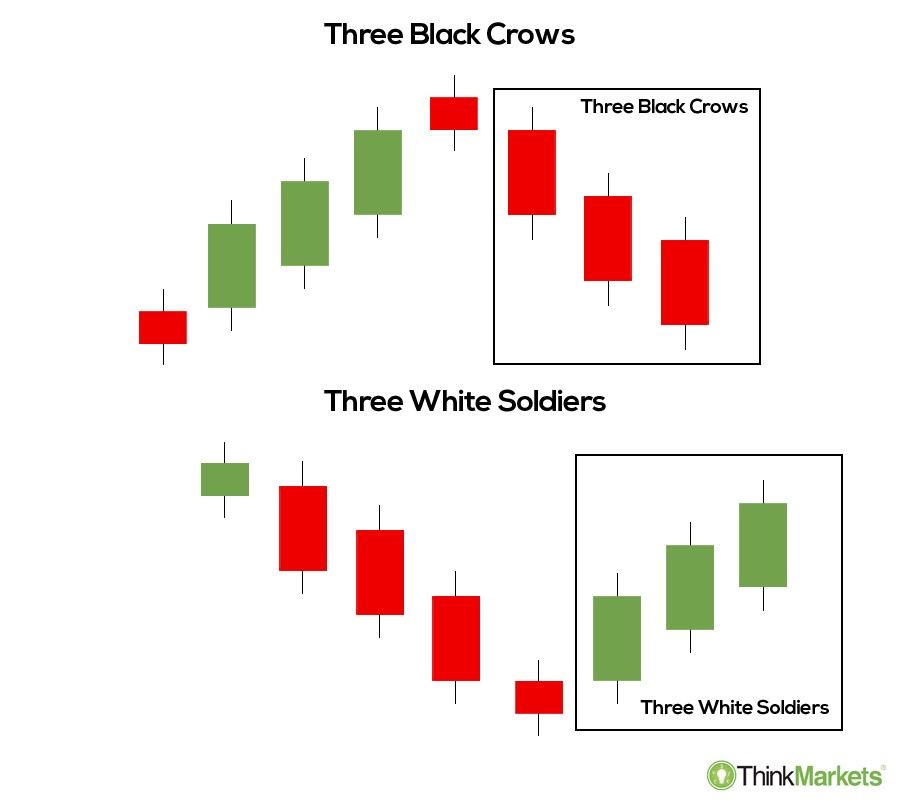
The opposite pattern of the Three White Soldiers is the Three Black Crows, which indicates a reversal of an uptrend.
What the Three White Soldiers Pattern Tells You
The Three White Soldiers pattern suggests a strong change in market sentiment, indicating a potential reversal of the current downtrend. The pattern is formed when the bulls take over the rally for three consecutive sessions and close near the high of the day. This bullish pattern may be preceded by other candlestick patterns suggestive of a reversal, such as a Doji.
How to Trade the Three White Soldiers Pattern
As a bullish visual pattern, the Three White Soldiers is used as an entry or exit point for traders. Those who are short on security may look to exit their position, while traders looking to take up a bullish position may see the pattern as an entry opportunity.
1. Watch for Overbought Conditions
When trading the Three White Soldiers pattern, it's essential to be aware of potential temporary overbought conditions. For instance, the Relative Strength Index (RSI) may have moved above the 70.0 level. In some cases, a short period of consolidation may follow the pattern, but the short- and intermediate-term bias remains bullish.
2. Monitor Resistance Levels
The significant move higher signaled by the Three White Soldiers pattern could also reach key resistance levels, where the security may experience consolidation before continuing to move higher. Traders should be cautious of these resistance levels before initiating a long position.
The Difference Between Three White Soldiers and Three Black Crows
The opposite of the Three White Soldiers pattern is the Three Black Crows candlestick pattern. The Three Black Crows consist of three consecutive long-bodied candlesticks that have opened within the real body of the previous candle and closed lower than the previous candle.
While the Three White Soldiers catch the momentum shift from the bears to the bulls, the Three Black Crows show the bears taking control of the bulls. The same caveats about volume and additional confirmation apply to both patterns.
Limitations of Using the Three White Soldiers Pattern
1. Appearance During Consolidation Periods
The Three White Soldiers pattern can also appear during periods of consolidation, which may lead to traders getting trapped in a continuation of the existing trend rather than a reversal. To avoid this pitfall, traders should pay close attention to the volume supporting the formation of the pattern.
2. Low-Volume Patterns
Any pattern formed on low volume can be suspect, as it represents the market action of a few rather than many. Traders should be cautious of patterns formed on low volume, as they may not be indicative of a genuine market reversal.
Combating Limitations with Additional Technical Indicators
To overcome the limitations of visual patterns, traders can use the Three White Soldiers pattern in conjunction with other technical indicators such as trendlines, moving averages, and Bollinger Bands.
For example, traders may look for areas of upcoming resistance before initiating a long position or examine the volume on the breakout to confirm that a high amount of dollar volume was transacted. If the pattern occurred on low volume with near-term resistance, traders may wait for further confirmation of a breakout before initiating a long position.
Conclusion
The Three White Soldiers pattern is an essential tool for traders looking to capitalize on bullish reversals. By understanding the pattern's key features and limitations, and employing additional technical indicators to confirm its validity, traders can make more informed decisions and potentially increase their chances of success in the market.
Always remember that no single pattern or indicator is foolproof, and a comprehensive trading strategy should incorporate multiple tools and techniques to ensure the best possible outcomes.
NOTE: This article is not investment advice for anyone because online trading could be a high risk for all who have a lack of knowledge & experience. 86% of traders lose money in financial markets. we are not your financial advisors who guarantee your profit at all.