The world of trading is filled with various technical tools and patterns that help traders make informed decisions. One such pattern is the Dark Cloud Cover, a bearish candlestick pattern that signals a potential reversal in the market.
In this comprehensive guide, we will delve into the details of the Dark Cloud Cover, discussing its significance, how it's formed, and how traders can use it in their trading strategies. So, let's begin!
What is the Dark Cloud Cover?
Dark Cloud Cover is a bearish reversal candlestick pattern that indicates a shift in momentum from the upside to the downside.
This pattern is characterized by a down candle (usually red or black) that opens above the close of the preceding up candle (typically green or white) and then closes below the midpoint of the up candle.
The presence of a Dark Cloud Cover pattern is significant because it shows that the market's momentum is shifting from bullish to bearish, potentially signaling the start of a downward trend. Traders often look for the price to continue declining in the next (third) candle, which is referred to as confirmation.
Key Takeaways:
Dark Cloud Cover is a bearish reversal candlestick pattern that signals a shift in momentum from the upside to the downside.
The pattern is formed by a bearish candle that opens above the close of the previous bullish candle and then closes below its midpoint.
Both candles in the pattern should be relatively large, indicating strong participation by traders and investors.
Traders usually look for confirmation in the form of a bearish candle following the Dark Cloud Cover pattern.
The Dark Cloud Cover pattern is often used in conjunction with other technical analysis tools and indicators.
Understanding the Dark Cloud Cover Pattern
The Dark Cloud Cover pattern is created when a large bearish candle forms a "dark cloud" over the preceding bullish candle. This shift from buying to selling pressure is similar to what occurs in a bearish engulfing pattern, where buyers initially push the price higher, but sellers eventually take control and push the price significantly lower.
Most traders consider the Dark Cloud Cover pattern to be useful only if it occurs after an uptrend or an overall increase in price. As prices rise, the pattern becomes more significant for marking a potential move to the downside. If the price action is choppy, the pattern is considered less significant since the price is likely to remain volatile after the pattern's formation.
Five Criteria for the Dark Cloud Cover Pattern:
An existing bullish uptrend.
A bullish candle within the uptrend.
A gap-up on the following day.
The gap up turns into a bearish candle.
The bearish candle closes below the midpoint of the previous bullish candle.
The Dark Cloud Cover pattern is further characterized by white and black candlesticks that have long real bodies and relatively short or non-existent shadows. These attributes suggest that the move lower was both highly decisive and significant in terms of price movement. Traders might also look for a confirmation in the form of a bearish candle following the pattern. If the price does not decline following the Dark Cloud Cover, it indicates that the pattern may fail.
Trading the Dark Cloud Cover Pattern
When trading the Dark Cloud Cover pattern, traders often use the close of the bearish candle as a signal to exit long positions. Alternatively, they may exit the following day if the price continues to decline (pattern confirmed). If entering short positions on the close of the bearish candle or the next period, a stop loss can be placed above the high of the bearish candle.
There is no specific profit target for a Dark Cloud Cover pattern. Instead, traders utilize other methods or candlestick patterns to determine when to exit a short trade based on the Dark Cloud Cover pattern.
Using the Dark Cloud Cover Pattern in Conjunction with Other Technical Analysis Tools
Traders often use the Dark Cloud Cover pattern alongside other forms of technical analysis to increase the likelihood of successful trades. Some examples of additional technical analysis tools that can be used in conjunction with the Dark Cloud Cover pattern include:
Relative Strength Index (RSI): Traders may look for an RSI greater than 70, which provides a confirmation that the security is overbought and may be due for a reversal.
Breakdown from Key Support Levels: A breakdown from a key support level following a Dark Cloud Cover pattern may signal that a downtrend is imminent.
Moving Averages: Traders may use moving averages to confirm the change in momentum signaled by the Dark Cloud Cover pattern, with a bearish crossover of shorter-term moving averages below longer-term moving averages acting as further confirmation.
Examples of Dark Cloud Cover Patterns in Trading
To better understand the Dark Cloud Cover pattern and its significance in trading, let's take a look at some real-world examples.
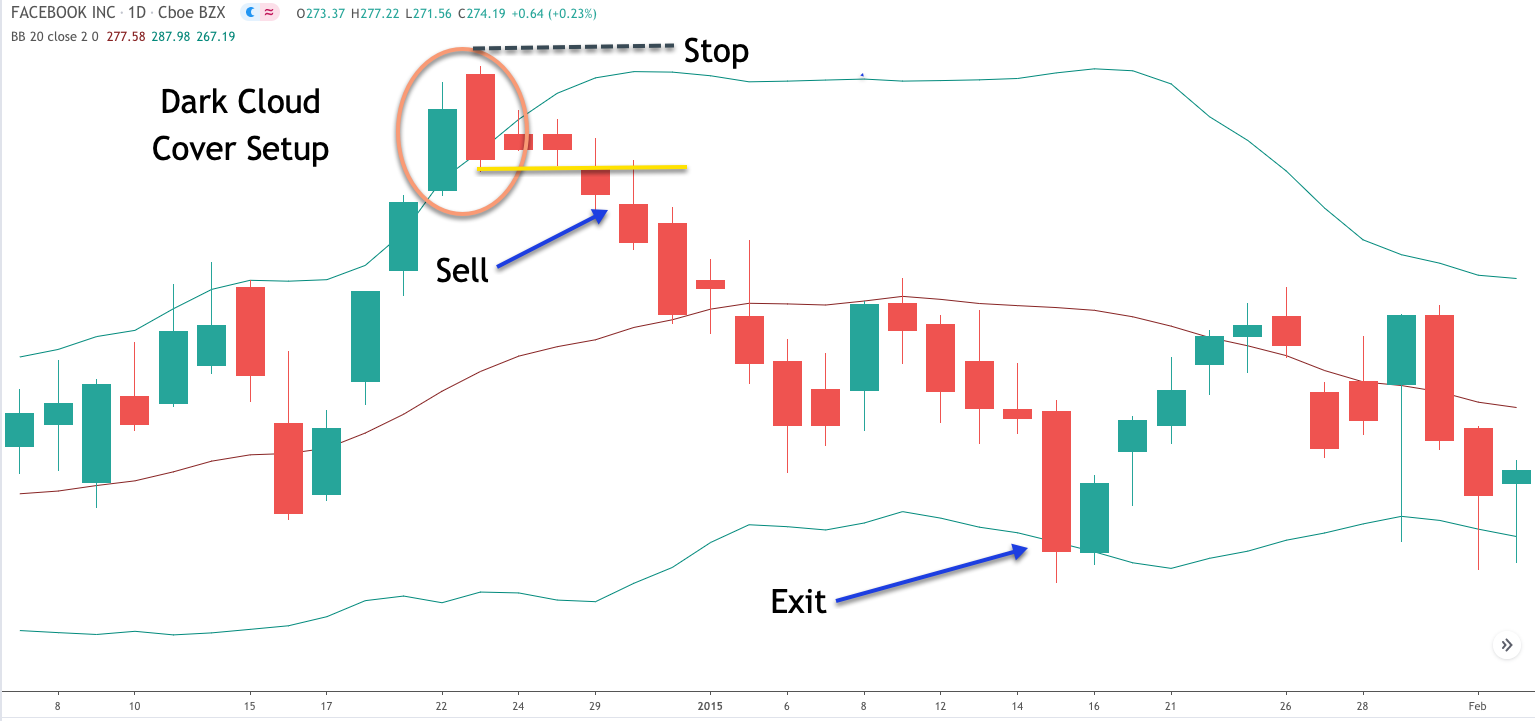
Example: Dark Cloud Cover in Facebook Inc.
In this example, a Dark Cloud Cover pattern appears after a strong uptrend in Apple Inc.'s stock price. The bearish candle in the pattern opens higher than the previous bullish candle's close and then closes below its midpoint. This pattern signals a potential reversal in the uptrend, which is confirmed by the following bearish candle.
Traders could have used this pattern as a signal to exit long positions or enter short positions. A stop loss could be placed above the high of the bearish candle in the pattern. As the price continues to decline, traders could adjust their stop loss levels or use other technical analysis tools to determine profit targets and exit points.
Limitations of the Dark Cloud Cover Pattern
While the Dark Cloud Cover pattern is a useful tool for identifying potential reversals in the market, it is essential to understand that no single technical indicator or pattern is foolproof. The Dark Cloud Cover pattern may not always accurately predict a reversal, and traders should be prepared for the possibility of false signals.
To mitigate the risk of false signals, traders should use the Dark Cloud Cover pattern in conjunction with other technical analysis tools and indicators. By doing so, they can increase the likelihood of successful trades and better manage their risk.
Conclusion
The Dark Cloud Cover pattern is a valuable tool for traders who want to identify potential reversals in the market. By understanding its significance, formation, and how to trade it effectively, traders can use this pattern to improve their trading strategies and increase their chances of success.
However, it is essential to keep in mind that no single pattern or indicator is foolproof, and traders should always use the Dark Cloud Cover pattern in conjunction with other technical analysis tools to maximize their chances of success.
NOTE: This article is not investment advice for anyone because online trading could be a high risk for all who have a lack of knowledge & experience. 86% of traders lose money in financial markets. we are not your financial advisors who guarantee your profit at all.