The head and shoulders pattern is a powerful and widely recognized chart formation that signals a potential trend reversal. In this comprehensive guide, we will delve deep into the head and shoulders pattern, its inverse formation, and how to effectively trade this chart pattern.
Introduction
The head and shoulders pattern is a chart formation used in technical analysis to predict a bullish-to-bearish trend reversal. It consists of a baseline with three peaks, where the outer two peaks (shoulders) are close in height, and the middle peak (head) is the highest. This pattern is considered one of the most reliable trend reversal patterns and is one of several top patterns that signal, with varying degrees of accuracy, that an upward trend is nearing its end.
Understanding the Head and Shoulders Pattern
The head and shoulders pattern forms when a stock's price rises to a peak and then declines back to the base of the prior up-move. The price then rises above the previous peak to form the "head" and declines back to the original base. Finally, the stock price peaks again at about the level of the first peak of the formation before falling back down.
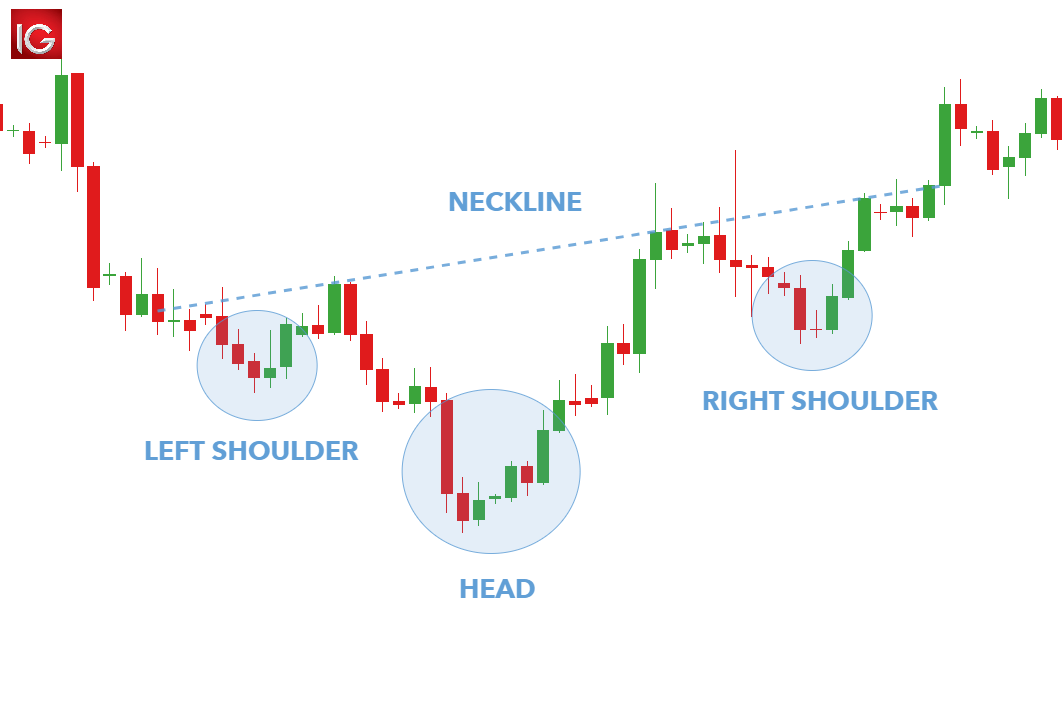
A head and shoulders pattern has four main components:
After a long bullish trend, the price rises to a peak and subsequently declines to form a trough (the first shoulder).
The price rises again to form a second high, substantially above the initial peak and declines again (the head).
The price rises a third time, but only to the first peak level, before declining again (the second shoulder).
The neckline is drawn at the two troughs or peaks (inverse).
The first and third peaks are the shoulders, and the second peak forms the head. The line connecting the first and second troughs is called the neckline.
The Inverse Head and Shoulders Pattern
The inverse head and shoulders pattern, also known as the head and shoulders bottom, is the opposite of the standard head and shoulders pattern. It is inverted, with the head and shoulders bottoms used to predict reversals in downtrends.
This pattern is identified when the price action of security meets the following characteristics:
The price falls to a trough, then rises.
The price falls below the former trough, then rises again.
The price falls again but not as far as the second trough.
Once the final trough is made, the price heads upward toward the resistance (the neckline) found near the top of the previous troughs.
An inverse head and shoulders pattern is also a reliable indicator, signaling that a downward trend is about to reverse into an upward trend. In this case, the stock's price reaches three consecutive lows, separated by temporary rallies.
The second trough is the lowest (the head), and the first and third are slightly shallower (the shoulders). The final rally after the third dip signals that the bearish trend has reversed, and prices are likely to keep rallying upward.
Key Components of the Head and Shoulders Pattern
The Shoulders
The shoulders of the head and shoulders pattern are formed by the first and third peaks. These peaks do not exceed the height of the head and are typically close in height. In an inverse head and shoulders pattern, the shoulders are formed by the first and third troughs, which do not fall lower than the depth of the head and are also typically close in depth.
The Head
The head is the central and most prominent feature of the head and shoulders pattern. It is the highest peak in the standard pattern and the lowest trough in the inverse pattern. The head must be higher (or lower in the inverse pattern) than the shoulders for the pattern to be considered valid.
The Neckline
The neckline is a crucial component of the head and shoulders pattern. It is a line drawn by connecting the lowest points of the two troughs in the standard pattern or the highest points of the two peaks in the inverse pattern. The slope of the neckline can either be up or down. Typically, when the slope is down in a standard head and shoulders pattern, it produces a more reliable signal.
What the Head and Shoulders Pattern Tells You
The head and shoulders pattern indicates that a reversal is possible. Traders believe that three sets of peaks and troughs, with a larger peak in the middle, mean a stock's price will begin falling in the standard pattern or rising in the inverse pattern. The neckline represents the point at which bearish traders start selling in the standard pattern or bullish traders start buying in the inverse pattern.
The pattern also indicates that the new downward trend in the standard pattern or upward trend in the inverse pattern will likely continue until the right shoulder is broken—where prices move higher than the prices at the right peak (standard pattern) or lower than the prices at the right trough (inverse pattern).
How to Trade the Head and Shoulders Pattern
Entry Point
To trade the standard head and shoulders pattern, place an entry order below the neckline after the formation of the second shoulder. In the case of the inverse head and shoulders pattern, place a long entry order above the neckline after the formation of the second shoulder.
Stop Loss and Profit Target
For both the standard and inverse head and shoulders patterns, set a stop loss above (standard) or below (inverse) the right shoulder. Calculate the profit target by measuring the distance between the high point of the head and the neckline in the standard pattern or the low point of the head and the neckline in the inverse pattern. This distance is approximately how far the price will move after it breaks the neckline.
Advantages and Disadvantages of the Head and Shoulders Pattern
Advantages
Easily identifiable by experienced traders.
Defined profit and risk levels.
Potential for significant market movements and profits.
Applicable across various markets, including forex and stock trading.
Disadvantages
Novice traders may miss or misinterpret the pattern.
Large stop-loss distances may be required.
Unfavorable risk-to-reward ratios are possible in some cases.
Reliability of the Head and Shoulders Pattern
The head and shoulders pattern is considered one of the most reliable trend reversal patterns. However, it is not foolproof, and there are instances where the pattern may fail or result in a continuation of the existing trend.
The most common entry point is a breakout of the neckline, with a stop above (market top) or below (market bottom) the right shoulder. The profit target is the difference between the high and low with the pattern added (market bottom) or subtracted (market top) from the breakout price. This method provides a logical approach to trading the markets based on price movements but does not guarantee success.
Variations of the Head and Shoulders Pattern
There are several variations of the head and shoulders pattern that traders should be aware of, such as the complex head and shoulders and the skewed head and shoulders. These variations can still provide reliable trend reversal signals but may require more experience and skill to identify and trade effectively.
Complex Head and Shoulders
The complex head and shoulders pattern features multiple shoulders and heads, making it more challenging to identify.
This pattern may still offer reliable trend reversal signals but requires a more careful analysis of the price action and chart formation.
Skewed Head and Shoulders
The skewed head and shoulders pattern is characterized by a slanted or angled neckline, making it more difficult for novice traders to recognize.
Despite the skewed neckline, this variation can still provide reliable trend reversal signals and can be traded using the same principles as the standard head and shoulders pattern.
Conclusion
The head and shoulders pattern and its inverse counterpart are powerful trend reversal indicators used by traders across various markets. By understanding the key components, applying proper trading strategies, and recognizing potential variations, traders can utilize this pattern to make informed decisions and potentially profit from market reversals. While the head and shoulders pattern is considered reliable, traders should always maintain proper risk management and be prepared for instances where the pattern may fail or not result in the expected trend reversal.
GENERAL RISK WARNING!
NOTE: This article is not investment advice for anyone because online trading could be a high risk for all who have a lack of knowledge & experience. 86% of traders lose money in financial markets. we are not your financial advisors who guarantee your profit at all.