The tweezer top pattern is a powerful and widely recognized reversal pattern used by traders to spot potential trend changes in the market. In this article, we will discuss the key aspects of the tweezer top pattern, its significance, and how traders can effectively use it to enhance their trading strategies.
What is a Tweezer Top Pattern?
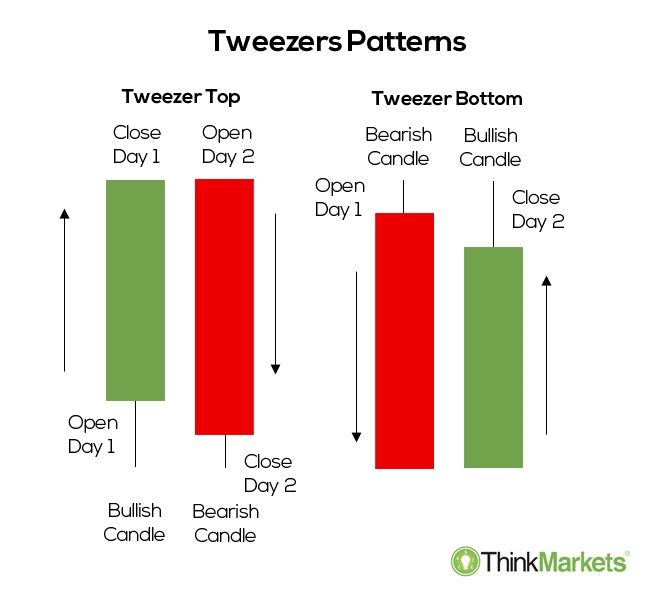
A tweezer top pattern is a candlestick pattern that occurs when the highs of two consecutive candlesticks are almost identical, following an uptrend. The pattern is considered a bearish signal, as it indicates the possibility of a trend reversal from bullish to bearish.
The tweezer top pattern consists of two candles:
First Candle: A strong bullish candle with a large real body (the difference between the open and close price) that closes near its high.
Second Candle: A smaller candle that can be any type, such as a Doji or a bearish candle, but with a similar high to the first candle.
The similarity in the highs of both candles suggests that sellers have entered the market, and the buying pressure may be weakening. As a result, the tweezer top pattern is often considered a potential sign of a short-term shift in momentum, alerting traders to the possibility of a bearish reversal.
What is a Tweezer Bottom Pattern?
In contrast to the tweezer top pattern, the tweezer bottom pattern is a bullish reversal pattern that occurs when the lows of two consecutive candlesticks are almost identical, following a downtrend. The pattern consists of two candles:
First Candle: A strong bearish candle with a large real body that closes near its low.
Second Candle: A smaller candle that can be any type, such as a Doji or a bullish candle, but with a similar low to the first candle.
The resemblance in the lows of both candles indicates that buyers have entered the market, and the selling pressure may be diminishing. Consequently, the tweezer bottom pattern is often viewed as a potential sign of a short-term shift in momentum, signaling the possibility of a bullish reversal.
Key Characteristics of Tweezer Patterns
1. Occurrence
Tweezer patterns, both top and bottom, occur quite frequently in financial markets. While they can be used as standalone signals, their effectiveness is significantly improved when used in conjunction with other technical analysis tools and signals.
2. Context
Tweezer patterns are more meaningful when they appear as part of other trends, especially during pullbacks. The broader context is crucial for confirming the signal, as tweezer patterns can occur frequently and may not always result in a trend reversal.
3. Variations
Tweezer patterns can take on various appearances, but all have a couple of traits in common, such as the similar highs or lows of the two candles. The size and type of the second candle can vary, making the pattern adaptable to different market conditions.
How to Identify Tweezer Patterns
1. Highs and Lows
The primary requirement for identifying a tweezer pattern is the similarity in the highs (for tweezer tops) or the lows (for tweezer bottoms) of the two consecutive candles. Even though the size and type of the second candle can differ, the highs or lows should be almost identical.
2. Real Body
For a tweezer top pattern, the first candle should have a large real body, indicating strong buying pressure. The second candle can have any size, but its real body should be smaller than the first candle. A similar rule applies to the tweezer bottom pattern, where the first candle should have a large real body, and the second candle should have a smaller real body.
3. Momentum Shift
A significant characteristic of tweezer patterns is the shift in momentum between the first and second candles. The first candle shows a strong move in the current trend direction, while the second candle pauses or slightly reverses the previous day's price action.
Trading Tweezer Patterns
1. Overall Trend Analysis
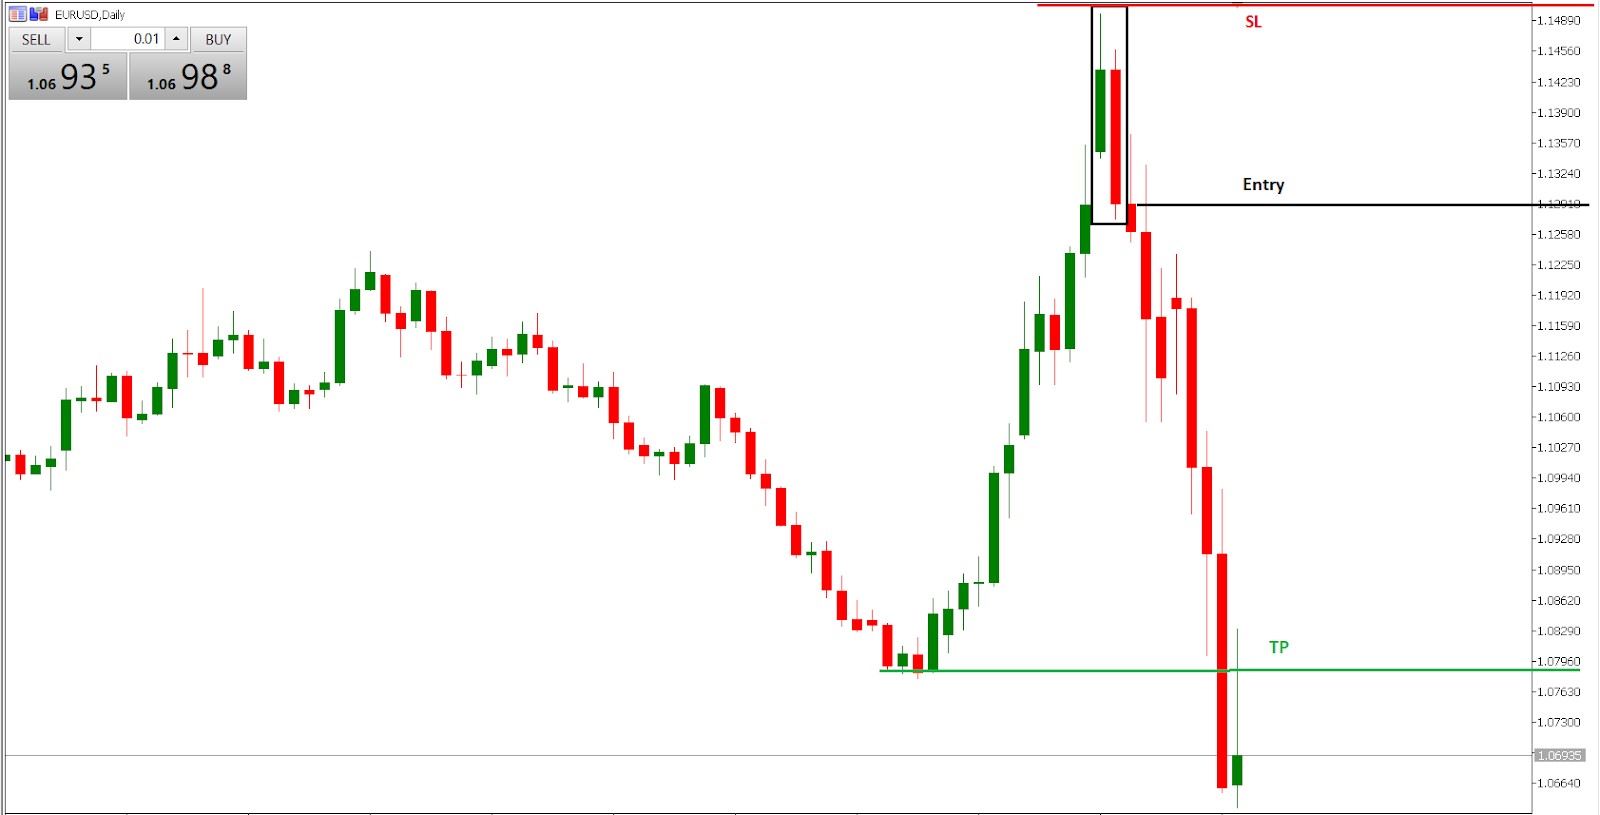
Analyzing the overall trend is crucial for determining the significance of a tweezer pattern. If a tweezer pattern occurs during a pullback within an overall trend, it can signal a potential entry point, indicating that the pullback may be over and the price is likely to resume moving in the trend's direction.
2. Stop Loss Placement
When trading tweezer patterns, placing a stop loss below the lows (for tweezer bottoms) or above the highs (for tweezer tops) can help manage risk effectively. Tweezer patterns do not provide a profit target, so traders must rely on other factors, such as the overall trend and momentum, to determine when to exit a trade.
3. Confirmation
It's essential to use the candles that occur after the tweezer pattern to confirm the short-term reversal signals. No pattern is perfect, and a tweezer pattern doesn't always result in a reversal. Practicing spotting and trading tweezer patterns in a demo account is recommended before initiating trades with real capital.
Tweezer Patterns in Conjunction with Other Technical Analysis Tools
Tweezer patterns work best when used in combination with other technical analysis tools and signals, such as support and resistance levels, moving averages, and other candlestick patterns. Some examples include:
Engulfing patterns: Bullish and bearish engulfing patterns, when they appear as tweezer patterns, add more significance to the pattern, increasing the likelihood of a trend reversal.
Hanging Man and Shooting Star: A strong up bar followed by a hanging man or shooting star candle is a noteworthy reversal pattern. A close below the second candle's real body within the next couple of candles is required to confirm the reversal.
Hammer: A strong down bar followed by a hammer candle is an equivalent bottoming pattern. A close above the hammer body within the next couple of candles would establish a strong case that a short-term bottom has formed.
The Bottom Line
Tweezer patterns, both top and bottom, can be valuable tools for traders to identify potential trend reversals. By understanding the key aspects of these patterns and using them in conjunction with other technical analysis tools, traders can enhance their trading strategies and improve their chances of success in the markets.
However, it's crucial to remember that no pattern is perfect, and practicing spotting and trading tweezer patterns is essential before initiating trades with real capital.
NOTE: This article is not investment advice for anyone because online trading could be a high risk for all who have a lack of knowledge & experience. 86% of traders lose money in financial markets. we are not your financial advisors who guarantee your profit at all.