If you’re an investor looking for a reliable and profitable way to trade in the financial market, you’ve likely heard of Fibonacci Retracement Levels. This powerful tool is designed to help traders identify key levels of potential support and resistance in the market.
In this article, we’ll take a look at everything you need to know about Fibonacci Retracement Levels, and how they can be used to maximize your profits.
Introduction to Fibonacci Retracement Levels
Fibonacci Retracement Levels are named after the famous Italian mathematician Leonardo Fibonacci. Fibonacci is best known for introducing the Fibonacci sequence, which is a series of numbers in which each number is the sum of the two numbers before it. This sequence can be seen in nature and has been used in trading for centuries.
Fibonacci Retracement Levels use the Fibonacci sequence to identify potential areas of support and resistance in the market. These levels are typically used by traders to determine where they should enter or exit a trade. Fibonacci Retracement Levels are typically used alongside technical indicators such as trendlines and support and resistance levels.
At their core, Fibonacci Retracement Levels are based on the concept of “retracement”.
Retracement is the idea that prices will often reverse direction at certain intervals. These intervals are based on the Fibonacci sequence and can be used to identify potential areas of support and resistance.
How to Use Fibonacci Retracement Levels
Fibonacci Retracement Levels are relatively easy to use. To begin, traders will need to identify a recent high and a recent low. This can be done by plotting the highs and lows on a chart.
Once the highs and lows have been identified, the Fibonacci Retracement Levels will be plotted in between them.
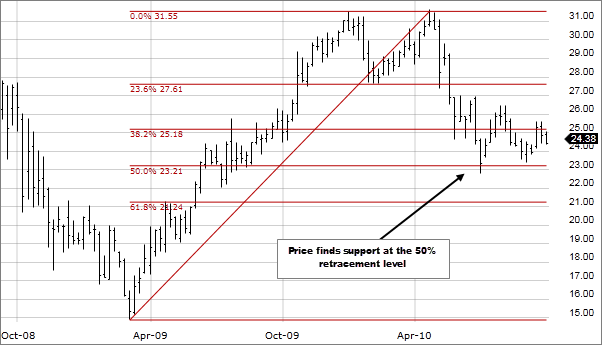
The most common Fibonacci Retracement Levels are the 23.6%, 38.2%, 50%, 61.8%, and 100% levels. These levels will then be used to identify potential areas of support and resistance. When the price retraces to one of these levels, it may indicate a potential opportunity to enter or exit a trade.
In addition to the Fibonacci Retracement Levels, traders may also use other tools such as trendlines and support and resistance levels. These tools can be used to provide additional confirmation of a potential trade.
Benefits of Using Fibonacci Retracement Levels
Fibonacci Retracement Levels offer a number of benefits to traders. The most obvious benefit is that they can help to identify potential areas of support and resistance. By using Fibonacci Retracement Levels, traders can get a better understanding of when to enter and exit a trade.
Fibonacci Retracement Levels can also help to identify potential entry and exit points for long-term trades. By identifying potential areas where the market may reverse direction, traders can use the Fibonacci Retracement Levels to identify potential entry and exit points for long-term trades.
Finally, Fibonacci Retracement Levels are relatively easy to use. Unlike other trading tools, Fibonacci Retracement Levels can be used by traders of all experience levels. This makes them an ideal tool for new traders looking to get started in the trading market.
Analyzing Market Trends with Fibonacci Retracement Levels
Fibonacci Retracement Levels can be used to identify potential areas of support and resistance in the financial market. This can be done by analyzing the market trends. By analyzing the market trends, traders can get a better understanding of the potential entry and exit points for their trades.
highs and lows
To begin, traders will need to identify the most recent highs and lows in the market. Once these levels have been identified, they can then plot the Fibonacci Retracement Levels. By doing this, traders can get a better understanding of the potential areas of support and resistance in the market.
Traders can then use the Fibonacci Retracement Levels to also know the potential entry and exit points for their trades. If the price retraces to one of the Fibonacci Retracement Levels, it may indicate an opportunity to enter or exit a trade.
Common Mistakes with Fibonacci Retracement Levels
When using Fibonacci Retracement Levels, it’s important to avoid making common mistakes. The most common mistake is to rely too heavily on the Fibonacci Retracement Levels. While these levels can be useful, they should not be used as the sole basis for a trade.
It’s also important to remember that Fibonacci Retracement Levels are not guaranteed. The market is unpredictable, and there is no way to know for sure where the price will go. As such, traders should use Fibonacci Retracement Levels in conjunction with other tools such as trendlines and support and resistance levels.
Finally, it’s important to remember that Fibonacci Retracement Levels are not a get-rich-quick scheme. While they can be useful tools, they should not be used as the sole basis for a trading strategy. As with any trading strategy, it’s important to understand the risks and rewards before entering into a trade.
Strategies for Using Fibonacci Retracement Levels
When using Fibonacci Retracement Levels, it’s important to have a strategy in place. One popular strategy is to enter a trade when the price retraces to one of the Fibonacci Retracement Levels. By doing this, traders can take advantage of potential price reversals.
Another popular strategy is to use Fibonacci Retracement Levels in conjunction with other tools such as trendlines and support and resistance levels. By using these tools together, traders can get a better understanding of potential entry and exit points for their trades.
The Best Times to Use Fibonacci Retracement Levels
Fibonacci Retracement Levels can be used at any time, however, there are certain times when they are most effective. The best time to use Fibonacci Retracement Levels is when the market is trending. When the market is trending, traders can use the Fibonacci Retracement Levels to identify potential areas of support and resistance.
In addition, Fibonacci Retracement Levels can also be used during periods of consolidation. During periods of consolidation, the Fibonacci Retracement Levels can be used to identify potential areas of support and resistance. This can help traders know the entry and exit levels for their trades.
Fibonacci Retracement Levels can also be used during periods of volatility. During periods of volatility, the Fibonacci Retracement Levels can be used to identify potential areas of support and resistance. This can help traders identify potential entry and exit levels for their trades.
Conclusion
Fibonacci Retracement Levels are a powerful tool that can be used by traders to identify potential areas of support and resistance. By using Fibonacci Retracement Levels, traders can get a better chance to get the opportunity of entry and exit points for their trades.
If you’re looking for a reliable and profitable way to trade in the financial market, then you should consider using Fibonacci Retracement Levels. By using this, you can get a better understanding of the market and maximize your profits.
So, why not give Fibonacci Retracement Levels a try today?
NOTE: This article is not investment advice for anyone because online trading could be a high risk for all who have a lack of knowledge & experience. 86% of traders lose money in financial markets. we are not your financial advisors who guarantee your profit at all.