Support and resistance levels are a crucial part of technical analysis and are used to identify potential entry and exit points for trades. In this comprehensive guide, we’ll explore how to identify and leverage support and resistance levels for maximum profits.
What are Support and Resistance Levels?
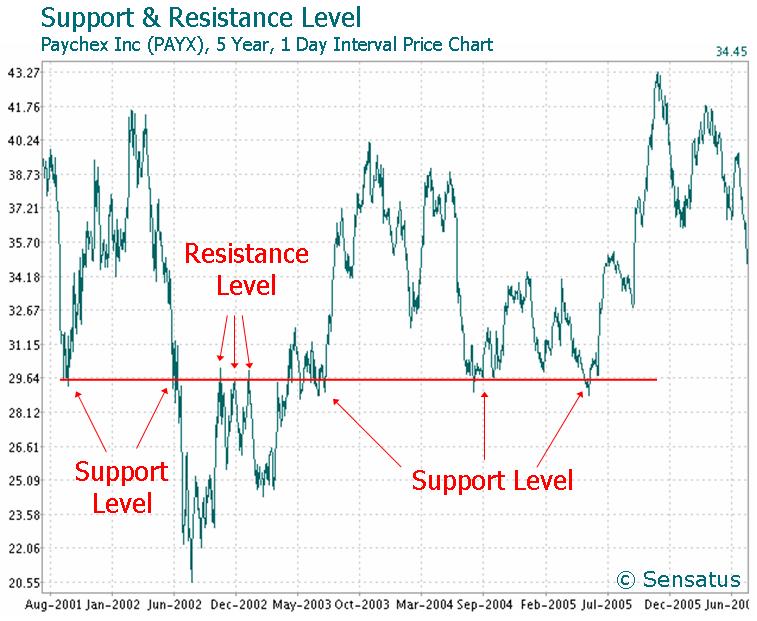
Support and resistance levels are price levels at which the price of an asset is expected to pause or reverse direction. These levels are used by traders to help identify when to enter and exit the market. They are based on the idea that the price of an asset tends to move in a specific direction until it reaches a level where the momentum shifts and the price reverses direction.
In other words, support and resistance levels are areas where the price of an asset is likely to pause or reverse. These levels can be used to identify potential entry and exit points for trades.
support and resistance levels
When looking for support and resistance levels, traders will often look for price levels at which the price of an asset has paused or reversed in the past. These levels are referred to as “key levels”, as they are important levels that traders watch and use to inform their trading decisions.
How to Identify Support and Resistance Levels
Identifying support and resistance levels can be done by analyzing the price action of an asset. Traders will usually look at the price chart of an asset, looking for price levels at which the price has paused or reversed in the past. These levels can then be used as potential support and resistance levels.
In addition to looking at the price chart, traders will often use other technical tools such as trend lines, Fibonacci retracements, and moving averages to help identify support and resistance levels.
It is important to note that these levels can change over time, so it is essential to keep an eye on the price action of an asset to identify any potential changes in support and resistance levels.
Types of Support and Resistance Levels
Support and resistance levels can be broadly categorized into two main types: horizontal levels and trend lines.
Horizontal levels are levels at which the price of an asset has paused or reversed in the past. These levels are based on historical price action and can be used to identify potential entry and exit points for trades.
trend lines
Trend lines are used to identify potential levels at which the price of an asset is likely to pause or reverse. These levels are based on the idea that the price of an asset tends to move in a specific direction until it reaches a level where the momentum shifts and the price reverses direction.
Leverage and Margin in Support and Resistance Trading
When trading with support and resistance levels, it is important to understand the concept of leverage and margin. Leverage is the use of borrowed capital to increase the potential return on investment. Margin is a type of collateral that is used as security for a loan.
When trading with leverage and margin, it is important to be aware of the potential risks. Leverage can increase the potential return on investment, but it can also increase the potential losses. Therefore, it is important to understand and manage the risk associated with leverage and margin trading.
How to Manage Risk in Support and Resistance Trading
When trading with support and resistance levels, it is important to understand and manage the risk associated with the trade. Risk management is an essential part of trading and can help traders avoid large losses.
There are several ways to manage risk in support and resistance trading. The most important is to use stop-loss orders. A stop-loss order is an instruction to close a position when the price of an asset reaches a certain level. This can help limit losses if the price moves against the trader’s position.
In addition to stop-loss orders, another way to manage risk is by using position sizing.
Position sizing is the process of determining the size of a trade based on the amount of capital the trader is willing to risk. This can help the trader limit their exposure to the market and ensure that their capital is not at risk.
Advanced Support and Resistance Strategies
Once a trader has mastered the basics of support and resistance trading, they can start to explore more advanced strategies.
These strategies include using multiple levels of support and resistance; using trend lines; and using other technical indicators such as Fibonacci retracements and moving averages.
These strategies can help traders identify more precise entry and exit points and increase the potential return of a trade. However, they can also add complexity to the trading process and increase the risk of losses. Therefore, it is important to understand and manage the risk associated with these strategies.
Support and Resistance Indicators
In addition to support and resistance levels, traders can also use indicators to help identify potential entry and exit points for trades. The most popular indicators used for support and resistance trading are Moving Averages and Fibonacci Retracements.
Moving averages are used to identify the average price of an asset over a period of time. They can be used to identify potential entry and exit points for trades based on the price action of the asset.
Fibonacci retracements are used to identify levels at which the price of an asset is likely to pause or reverse. These levels are based on the Fibonacci sequence and are used to identify potential entry and exit points for trades.
Tips for Trading with Support and Resistance Levels
When trading with support and resistance levels, there are several tips that can help traders improve their trading performance.
The first tip is to maintain a disciplined approach. It is important to stick to a plan and follow a consistent strategy. This will help the trader stay focused and limit potential losses.
The second tip is to use stop-loss orders. Stop-loss orders can help limit losses if the price of an asset moves against the trader’s position.
The third tip is to maintain a risk-reward ratio. This will help the trader ensure that their potential profits outweigh their potential losses.
The fourth tip is to maintain a diversified portfolio. This will help the trader spread their risk across different assets and reduce the risk of large losses.
Finally, it is important to keep an eye on the price action of an asset to identify any potential changes in support and resistance levels.
Conclusion
In conclusion, support and resistance levels are an important part of technical analysis and are used to identify potential entry and exit points for trades. In this comprehensive guide, we have explored how to identify and leverage support and resistance levels for maximum profits.
We have also discussed how to manage risk in support and resistance trading, as well as the different types of support and resistance levels and the advanced strategies that can be used to identify more precise entry and exit points.
Finally, we have provided some tips for trading with support and resistance levels. By following these tips and understanding the concept of support and resistance levels, traders can increase their chances of success in the markets.
NOTE: This article is not investment advice for anyone because online trading could be a high risk for all who have a lack of knowledge & experience. 86% of traders lose money in financial markets. we are not your financial advisors who guarantee your profit at all.