Are you looking to master the art of trading with spinning top candlesticks? You’ve come to the right place. Spinning top candlestick is one of the most popular technical analysis tools used by traders today. In this comprehensive guide, we’ll break down everything you need to know about spinning top candlestick and how to use it to your advantage in trading.
Introduction to Spinning Top Candlestick
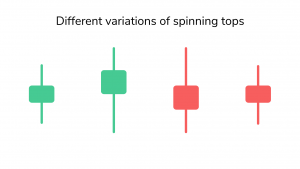
A spinning top candlestick is a type of chart pattern used in technical analysis to identify potential reversals in the price of an asset. It is comprised of a single candle with a small body and relatively long wicks on both sides.
The wicks indicate that buyers and sellers are competing, but the small body indicates that the competition is evenly matched. As a result, the price of the asset is not moving significantly in either direction.
Spinning top candlestick is one of the most popular chart patterns used by traders. It can be used to identify potential reversals in the price of an asset, which can provide an opportunity to enter a new trade or close an existing one. The pattern can also be used to identify support and resistance levels, as well as indicate when a trend is likely to continue or reverse.
Key Characteristics of Spinning Top Candlestick
Before you can begin to use spinning top candlesticks in your trading strategies, it’s important to understand the key characteristics of this chart pattern.
First, the body of the spinning top candlestick is generally small, relative to the wicks. This indicates that buyers and sellers are evenly matched and the price of the asset is not moving significantly in either direction.
Second, the wicks of the spinning top candlestick are generally quite long, relative to the body. This indicates that buyers and sellers are competing but neither side is able to gain control.
Third, the spinning top candlestick indicates that the market is in a state of indecision, as neither buyers nor sellers are able to gain control. This could indicate that the direction of the price of the asset is about to reverse, as one side eventually gains control.
Finally, the spinning top candlestick indicates that there is a certain level of volatility in the market, as buyers and sellers are competing. This could indicate that the market is about to make a significant move in either direction.
Types of Spinning Top Candlesticks
The spinning top candlestick is one of the most popular chart patterns used by traders and there are three types of spinning top candlesticks.
Bearish spinning top: This type of spinning top candlestick indicates that buyers were initially in control of the market, but sellers eventually gained control and pushed the price of the asset lower.
Bullish spinning top: This type of spinning top candlestick indicates that sellers were initially in control of the market, but buyers eventually gained control and pushed the price of the asset higher.
Neutral spinning top: This type of spinning top candlestick indicates that buyers and sellers are evenly matched and neither side is able to gain control.
Benefits of Using Spinning Top Candlestick
Now that you understand the key characteristics of spinning top candlesticks, let’s take a look at some of the benefits of using this chart pattern in your trading strategies.
One of the main benefits of spinning top candlestick is that it can help you identify potential reversals in the price of an asset.
Another benefit of spinning top candlesticks is that they can help you identify support and resistance levels. By recognizing this chart pattern, you can better anticipate when the price of an asset is likely to move in either direction.
Finally, spinning top candlestick can also help you identify when a trend is likely to continue or reverse. By recognizing this chart pattern, you can better anticipate when the market is about to make a significant move in a direction.
Risks of Using Spinning Top Candlestick
As with any trading strategy, there are certain risks associated with using a spinning top candlestick.
The biggest risk of using spinning top candlesticks is that it can be difficult to accurately identify when the market is about to make a significant move in either direction. This is because the pattern can be easily misinterpreted and it’s not always clear when the market is about to make a move.
Another risk of using a spinning top candlestick is that it can be difficult to accurately identify support and resistance levels. This is because the pattern can be easily misinterpreted and it’s not always clear when the price of an asset is likely to move in either direction.
spinning top candlestick can also be difficult to interpret, as it can be affected by outside factors such as news and economic data. This can make it difficult to accurately identify when the market is about to make a change.
How to Interpret Spinning Top
Now that you understand the key characteristics and risks of spinning top candlesticks, let’s take a look at how to interpret this chart pattern.
When interpreting a spinning top candlestick, it’s important to look for patterns in the wicks and body of the candle. If the wicks are long and the body is small, it indicates that buyers and sellers are evenly matched and the price of the asset is not moving significantly in either direction. If the wicks are short and the body is large, it indicates that one side is in control and the price of the asset is likely to move in that direction.
It’s also important to look at the volume of the candle as well. If the volume is high, it indicates that there is a lot of interest in the asset and the price is likely to move in a direction. If the volume is low, it indicates that there is not much interest in the asset and the price is likely to remain stable.
Candlestick Patterns
Spinning top candlestick is one of the most popular chart patterns used by traders and there are several patterns that you can look for when interpreting this chart pattern.
The first pattern is the bearish spinning top. This pattern indicates that buyers were initially in control of the market, but sellers eventually gained control and pushed the price of the asset lower.
The second pattern is the bullish spinning top. This pattern indicates that sellers were initially in control of the market, but buyers eventually gained control and pushed the price of the asset higher.
The third pattern is the hammer. This pattern indicates that buyers were initially in control of the market, but sellers eventually gained control and pushed the price of the asset lower.
The fourth pattern is the inverted hammer. This pattern indicates that sellers were in control of the market, but buyers eventually gained control and pushed the price of the asset higher.
Spinning Top Trading Strategies
Now that you understand the key characteristics and patterns of spinning top candlesticks, let’s take a look at some trading strategies that you can use with this chart pattern.
The first strategy is to use the pattern to identify potential reversals in the price of an asset. By recognizing this pattern, you can better anticipate when the market is about to make a significant move in either direction.
The second strategy is to use the pattern to identify support and resistance levels. By recognizing this pattern, you can better understand when the price of an asset is likely to move in either direction.
The third strategy is to use the pattern to identify when a trend is likely to continue or reverse. By recognizing this pattern, you can better understand when the market is about to make a significant move in either direction.
Best Practices for Trading with Spinning Top
Before you begin trading with spinning top candlesticks, it’s important to understand the best practices for using this chart pattern.
It’s important to be patient when interpreting this chart pattern. As we mentioned earlier, spinning top candlestick is affected by outside factors such as news and economic data, so it’s important to wait until the market has had time to digest this information before making a trading decision.
And then, confirm your trading decisions with other indicators. As we mentioned earlier, spinning top candlestick can be difficult to interpret, so it’s important to use other indicators such as moving averages and support and resistance levels to confirm your trading decisions.
However, practice risk management when trading with spinning top candlesticks. As with any trading strategy, there is always a certain level of risk involved, so it’s important to practice proper risk management and only risk what you can afford to lose.
Conclusion
In conclusion, spinning top candlestick is one of the most popular chart patterns used by traders today. It can be used to identify potential reversals in the price of an asset, as well as identify support and resistance levels and indicate when a trend is likely to continue or reverse.
However, it’s important to understand the key characteristics and risks associated with this chart pattern before you begin trading with it. It’s also important to understand the different types of spinning top candlesticks, as well as the different patterns and trading strategies that you can use with this chart pattern.
Finally, it’s important to practice proper risk management when trading with a spinning top candlestick and to confirm your trading decisions with other indicators.
With the right knowledge and strategies, you can use spinning top candlesticks to your advantage in trading.
NOTE: This article is not investment advice for anyone because online trading could be a high risk for all who have a lack of knowledge & experience. 86% of traders lose money in financial markets. we are not your financial advisors who guarantee your profit at all.


:max_bytes(150000):strip_icc()/dotdash_Final_Spinning_Top_Candlestick_Definition_and_Example_Nov_2020-01-9ebe4d0e8ccb482c92214128a29874de.jpg)