As a trader, one of the most important things you need to do is to identify the right trading patterns. These patterns can help you to make profitable trades and avoid losses. In this article, I will be discussing the ultimate trading chart patterns for profitable trading.
Introduction to Trading Chart Patterns
Trading chart patterns are graphical representations of the price movements of a security over a period of time. These patterns can be used to analyze the market and make informed trading decisions. Chart patterns are commonly used by traders and investors to identify trends, reversals, and market conditions.
Benefits of Using Trading Chart Patterns
Using trading chart patterns can provide a number of benefits to traders, including:
1. Identifying Market Trends
Chart patterns can help traders identify market trends, which is essential for making profitable trades. By identifying trends, traders can determine whether to buy or sell a security.
2. Predicting Price Movements
Chart patterns can also help traders predict price movements. By analyzing past price movements, traders can identify patterns that suggest future price movements.
3. Reducing Risk
Using chart patterns can help traders reduce risk by identifying potential entry and exit points. This can help traders avoid losses and maximize profits.
Common Trading Chart Patterns
There are several common trading chart patterns that traders should be familiar with. These include:
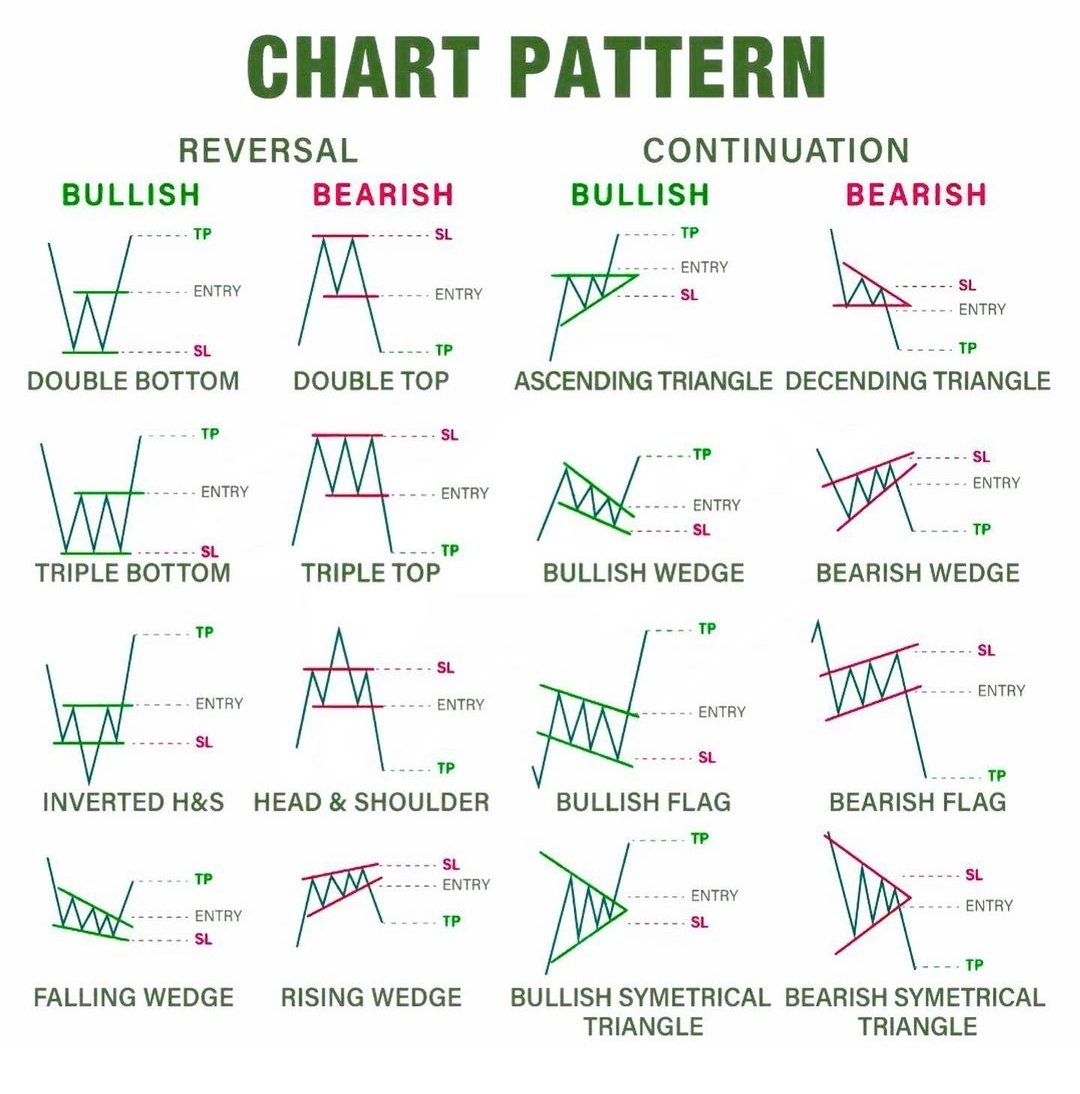
Bullish chart patterns are patterns that suggest that the price of a security is likely to increase. Examples of bullish chart patterns include the cup and handle pattern, the ascending triangle pattern, and the double bottom pattern.
2. Bearish Chart Patterns
Bearish chart patterns are patterns that suggest that the price of a security is likely to decrease. Examples of bearish chart patterns include the head and shoulders pattern, the descending triangle pattern, and the double top pattern.
3. Reversal Chart Patterns
Reversal chart patterns are patterns that suggest that the price of a security is about to reverse direction. Examples of reversal chart patterns include the hammer pattern, the bullish engulfing pattern, and the dark cloud cover pattern.
4. Continuation Chart Patterns
Continuation chart patterns are patterns that suggest that the price of a security is likely to continue in the same direction. Examples of continuation chart patterns include the flag pattern, the pennant pattern, and the rectangle pattern.
How to Identify Trading Chart Patterns
Identifying trading chart patterns can be challenging, especially for novice traders. However, there are a few key steps that traders can take to help identify chart patterns:
1. Study Chart Patterns
The first step in identifying chart patterns is to study them. Traders should familiarize themselves with the different types of chart patterns and learn how to identify them.
2. Use Technical Indicators
Traders can also use technical indicators to help identify chart patterns. Technical indicators such as moving averages and relative strength index (RSI) can be useful in identifying patterns.
3. Analyze Price Movements
Finally, traders should analyze price movements to identify patterns. This involves looking at historical price data and identifying patterns that suggest future price movements.
Trading Chart Patterns Strategies
Once traders have identified trading chart patterns, they can use a variety of strategies to trade them. Some common strategies include:
1. Breakout Trading
Breakout trading involves buying or selling a security when it breaks out of a trading range. This strategy is often used with continuation chart patterns.
2. Trend Trading
Trend trading involves buying or selling a security when it is in an established trend. This strategy is often used with reversal chart patterns.
3. Counter-Trend Trading
Counter-trend trading involves buying or selling a security when it is moving against the established trend. This strategy is often used with reversal chart patterns.
Tools for Trading Chart Patterns Analysis
There are several tools that traders can use to analyze trading chart patterns. These include:
1. Trading Software
Trading software such as MetaTrader and TradingView can be useful in analyzing trading chart patterns. These platforms offer a range of technical indicators and charting tools that can help traders identify patterns.
2. Online Resources
There are also a number of online resources that traders can use to learn more about trading chart patterns. These include websites, forums, and online courses.
3. Trading Mentors
Finally, traders can seek out mentors who can help them learn more about trading chart patterns. Mentors can offer guidance and advice based on their own experiences in the market.
Trading Chart Patterns in Real-Time
Trading chart patterns can be used in real-time to make profitable trades. However, traders should be aware that real-time trading can be challenging and require a high degree of skill and experience.
Conclusion
Trading chart patterns are an essential tool for traders who want to make profitable trades. By identifying the right patterns and using the right strategies, traders can reduce risk and maximize profits.
However, traders should be aware that trading chart patterns require a high degree of skill and experience. To learn more about trading chart patterns, seek out online resources, trading software, and mentors.
GENERAL RISK WARNING!
NOTE: This article is not investment advice for anyone because online trading could be a high risk for all who have a lack of knowledge & experience. 86% of traders lose money in financial markets. we are not your financial advisors who guarantee your profit at all.