As a trader or investor, one of the key concepts that you need to understand is trend momentum. It is a critical factor in determining the direction of the market and the potential for future price movements. In this article, we will explore the concept of trend momentum, how it is calculated, and why it matters in trading and technical analysis.
Introduction to Trend Momentum
Trend momentum is a measure of the strength and direction of a trend. It is calculated by comparing the current price of an asset to its historical price levels. If the price is moving higher, trend momentum is said to be positive, while if the price is moving lower, trend momentum is negative.
Trend momentum is an essential tool in technical analysis, as it helps traders and investors identify the direction of the market and the potential for future price movements. Understanding trend momentum can help you make better trading decisions and improve your profitability.
What is Trend Momentum?
Trend momentum is a measure of the rate at which the price of an asset is changing. It is calculated by comparing the current price of an asset to its historical price levels. If the current price is higher than the historical average, the trend momentum is positive, while if the current price is lower than the historical average, the trend momentum is negative.
Trend momentum is closely related to the concept of trend following. Traders and investors use trend momentum to identify the direction of the market and the potential for future price movements.
By following the trend momentum, traders and investors can take advantage of the market's momentum and profit from the price movements.
How Trend Momentum is Calculated
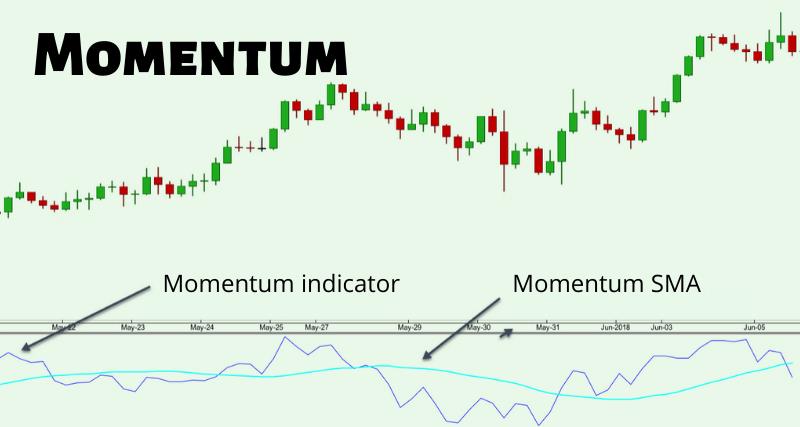
Trend momentum is calculated using various technical indicators, including moving averages, relative strength index (RSI), and stochastic oscillators. These indicators are used to identify the rate at which the price of an asset is changing and to determine the strength and direction of the trend.
Moving averages are one of the most popular indicators used to calculate trend momentum. They are calculated by taking the average price of an asset over a specific period, such as 50 or 200 days. By comparing the current price to the moving average, traders can identify the trend momentum and potential for future price movements.
Other indicators, such as RSI and stochastic oscillators, are used to identify overbought and oversold conditions in the market. These indicators can help traders and investors identify potential trend reversals and changes in trend momentum.
Understanding Trend Momentum in Financial Markets
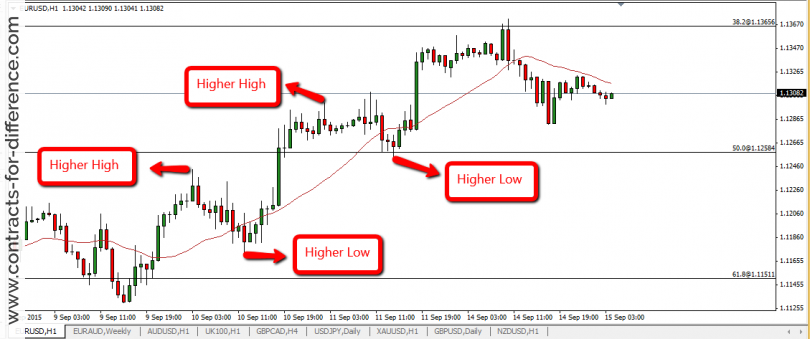
Trend momentum is a critical factor in determining the direction of financial markets. When trend momentum is positive, it indicates that the market is bullish, and prices are likely to continue to rise. Conversely, when trend momentum is negative, it indicates that the market is bearish, and prices are likely to continue to fall.
Understanding trend momentum can help traders and investors identify potential opportunities in the market. By following the trend momentum, traders can take advantage of the market's momentum and profit from the price movements.
The Importance of Trend Momentum
Trend momentum is particularly important in trend-following strategies, where traders aim to profit from the market's momentum. By identifying the trend momentum, traders can enter trades at the right time and maximize their profitability.
How to Use Momentum in Technical Analysis
Trend momentum is a critical tool in technical analysis, as it helps traders and investors identify the direction of the market. There are various indicators that traders can use to calculate trend momentum, including moving averages, RSI, and stochastic oscillators.
To use trend momentum in technical analysis, traders need to identify the trend direction and momentum. They can then use this information to enter trades at the right time and maximize their profitability.
Examples of Trend Momentum Indicators
There are various indicators that traders can use to calculate trend momentum. Some of the most popular indicators include moving averages, RSI, and stochastic oscillators. Here are some examples of these indicators:
Moving Averages:Moving averages are one of the most popular indicators used to calculate trend momentum. They are calculated by taking the average price of an asset over a specific period, such as 50 or 200 days. By comparing the current price to the moving average, traders can identify the trend momentum and potential for future price movements.
RSI:The relative strength index (RSI) is an oscillator that measures the strength of the trend. It is calculated by comparing the average gains and losses of an asset over a specific period. When the RSI is above 70, it indicates that the asset is overbought, while when it is below 30, it indicates that the asset is oversold.
Stochastic Oscillators:Stochastic oscillators are another popular indicator used to calculate trend momentum. They are calculated by comparing the current price of an asset to its recent price range. When the stochastic oscillator is above 80, it indicates that the asset is overbought, while when it is below 20, it indicates that the asset is oversold.
How to Identify Trend Momentum Shifts
Identifying trend momentum shifts is critical in trading, as it can help traders and investors avoid losses. There are various indicators that traders can use to identify trend momentum shifts, including moving averages, RSI, and stochastic oscillators. To identify trend momentum shifts, traders need to look for changes in the trend direction and momentum.
For example, if the trend has been bullish and the momentum has been positive, but the price suddenly drops below the moving average, it could indicate a shift in trend momentum.
The Limitations of Trend Momentum
While trend momentum is a critical factor in trading and technical analysis, it is not foolproof. There are various limitations to trend momentum, including false signals and the impact of external factors on the market.
Traders and investors need to be aware of these limitations and use other tools and indicators to confirm trend momentum signals. By using a combination of indicators and tools, traders can improve their accuracy and profitability.
Conclusion
In conclusion, trend momentum is a critical factor in trading and technical analysis. It helps traders and investors identify the direction of the market and opportunities. By following the trend momentum, traders can take advantage of the market's momentum and profit from the price movements.
There are various indicators that traders can use to calculate trend momentum, including moving averages, RSI, and stochastic oscillators. Traders need to be aware of the limitations of trend momentum and use other tools and indicators to confirm trend momentum signals.
Overall, understanding trend momentum is essential for anyone who wants to succeed in trading and investing. By mastering this concept, you can improve your profitability and achieve your financial goals.
GENERAL RISK WARNING!
NOTE: This article is not investment advice for anyone because online trading could be a high risk for all who have a lack of knowledge & experience. 86% of traders lose money in financial markets. we are not your financial advisors who guarantee your profit at all.